
Q2 2026 Eastern PA Industrial Development and Construction
Lee & Associates of Eastern PA tracks the progression of industrial development projects on a quarterly basis, from the time projects move through approvals to when they break ground and ultimately deliver. This market intelligence provides a clear view of potential future supply and the portion of that supply most likely to reach the market.
This quarterly series tracks industrial projects of 100,000 square feet or more across the six major Greater Philadelphia submarkets: Central Pennsylvania, Lehigh Valley, Northeastern Pennsylvania, Metro Philadelphia, Southern New Jersey, and Delaware.
NEW ANNOUNCEMENTS INCREASE IN Q2
In Q2 2026, we captured 19 new industrial project announcements through various news sources, up from 14 new announcements in each of the prior two quarters. The 19 new announcements represent nearly 12 million square feet of potential development, the highest quarterly total in the past eight quarters.
Tracking new development announcements is not necessarily a forecast of future construction. These projects still face entitlement, financing, design, and market hurdles before they break ground, a process that can sometimes take 18 months or more. The takeaway from this information is that developers continue to identify opportunities across Eastern PA.
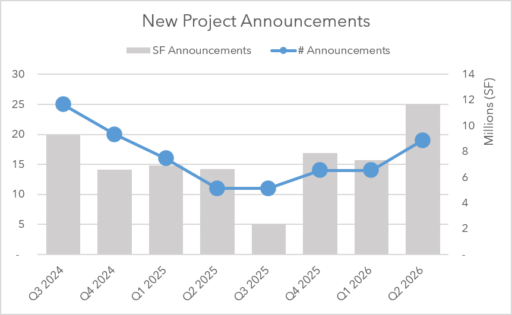
New Project Announcements: The number of new industrial projects added to the pre-construction pipeline based on news reports, public sources, social media, or announcements from brokers and owners. The chart shows quarterly project-announcement counts alongside the total square footage represented by those projects.
THE FULL DEVELOPMENT PIPELINE REMAINS LARGE AND RELATIVELY STABLE
At the end of Q2 2026, the development pipeline in the Greater Philadelphia industrial market contained just over 213 million square feet. That total has generally stayed within a range of 200 million to 230 million square feet since 2021.
The stability of the total does not suggest that the pipeline is static. New proposals continue to be added as some projects advance, change, stall, or fall away. Of the projects we are tracking, about half are moving through entitlements. The other half are either fully approved or considered “pad-ready.”
CONSTRUCTION ACTIVITY CONTINUED TO MODERATE IN Q2
At the end of Q2, about 17.8 million square feet of industrial space was under construction. Nearly 12 million square feet of that space is expected to deliver within the next six months. Projects under construction remain at some of the lowest levels seen over the past five years, aligning more closely with the market in the pre-COVID era.
In Q2, construction starts and deliveries were closely aligned, with 4.2 million square feet starting construction and 4.4 million square feet being delivered. The close relationship between starts and deliveries reflects the market’s more measured construction cycle.
One of the more notable shifts in the current pipeline is its composition. Speculative construction accounted for approximately 63% of space underway, down from a peak near 95% during the recent development cycle. Build-to-suit activity increased to 37%. This mix is also close to the balance seen in the market around 2020 and early 2021, before the COVID warehouse boom drove speculative construction to its highest levels.
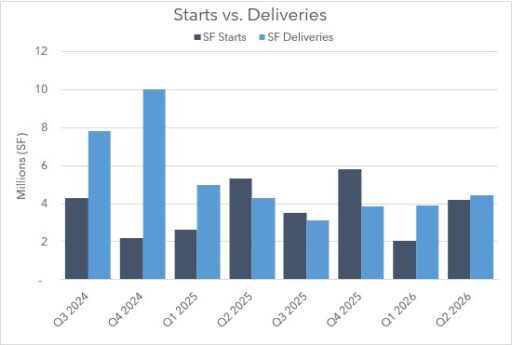
Starts vs. Delivers: The chart shows the quarterly square footage of industrial construction starts compared with construction deliveries in the Greater Philadelphia region. Construction starts are projects that have broken ground and have stated vertical intent. Construction deliveries are projects that have reached substantial completion and are ready for tenant build-out.
THE TAKEAWAY FOR EASTERN PA
Q2 added more projects to Eastern PA’s development pipeline, but the overall pipeline remained relatively stable. That points to continued long-term development potential, while the lower level of construction activity suggests that new supply is entering the market at a more measured pace.
With fewer projects moving from planning to construction, the market has more time to absorb the space delivered during the recent development cycle. For developers, owners, and tenants, the key issue will be how quickly today’s proposed projects advance as demand and market conditions evolve.