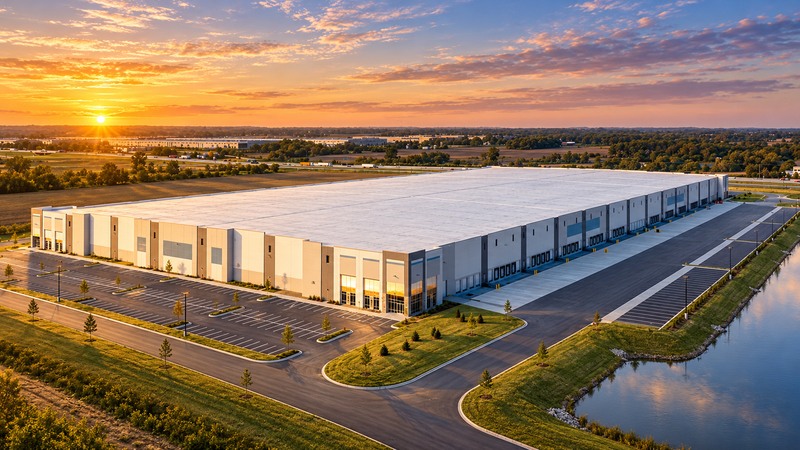
FEATURED PROPERTY · Kenosha, Wisconsin
Somers Logistics Center
200,000–795,471 SF available · Industrial · Built 2023
 CHICAGO / RESEARCH
Q3 2026 CHICAGO INDUSTRIAL
Q3 2026 Chicago Industrial Market Report
+6.8M SF quarterly net absorption Source: Overall Market, p. 3.
Download Full Q3 Report (PDF)44-PAGE PDF · 15.1 MB · FULL REPORT
Explore Interactive Research5.09%
+25 bps quarter-over-quarter
+6.8M SF
15 of 18 submarkets positive
16.6M SF
+2.0M SF quarter-over-quarter
8.29%
−17 bps quarter-over-quarter
Source: Q3 2026 Industrial Market Report, pp. 2–3. Selected figures rounded as in the report narrative.
FEATURED PROPERTY · Kenosha, Wisconsin
200,000–795,471 SF available · Industrial · Built 2023
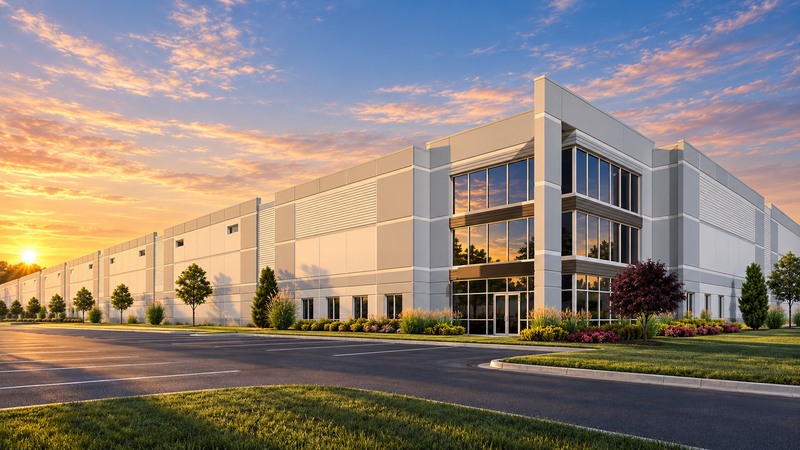
FEATURED PROPERTY · Geneva, Illinois
21,000–875,000 SF available · Build-to-suit opportunity
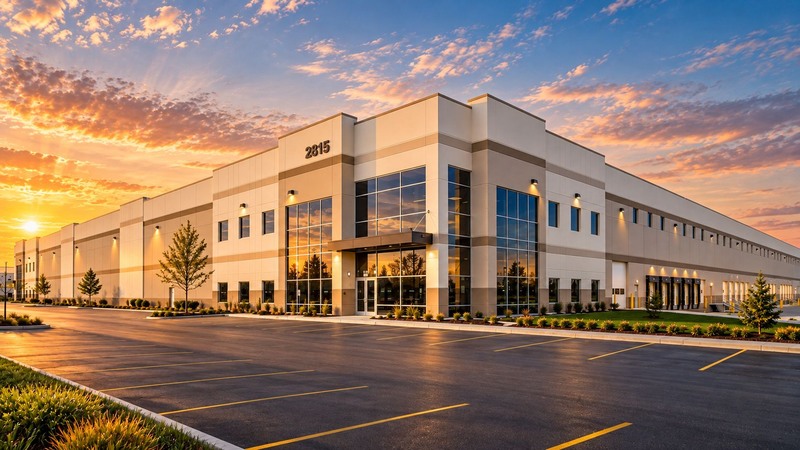
FEATURED PROPERTY · Mount Pleasant, Wisconsin
97,000–390,318 SF available · Industrial · Building VI · Built 2023
01 / MARKET PERSPECTIVE
Chicago industrial demand remained broad in the third quarter, with positive absorption across 15 of 18 submarkets.
Leasing activity reached 16.6 million SF, up 2.0 million SF from the prior quarter. Vacancy rose while availability declined, leaving a mixed but constructive occupancy picture.
Space under construction increased to 17.5 million SF, while 2.1 million SF delivered during the quarter. The larger development pipeline remains an important part of the near-term supply backdrop.
Read the market overviewSource: Overall Market, p. 3.
02 / THE LOCAL PICTURE
Explore the underlying numbers.
All figures from the Q3 2026 report.
Compare vacancy and availability, then examine absorption, asking net rent and construction.
View source tableCURRENT QUARTER · Q3 2026
Source: supplied report, p. 2. Current-rate bars: 0–15%. Values shown exactly as published.
Q3 2025–Q3 2026 · Q2–Q3 change below
Vacancy
Availability
| Quarter | Vacancy | Availability | Trailing 12-month absorption (SF) |
|---|
Trailing 12-month absorption is distinct from the quarterly net absorption shown above. Changes use published rounded rates. Direction summarizes vacancy and availability: both falling = tightening; both rising = softening; opposing moves = mixed.
| Submarket | Vacancy | Availability | Quarterly absorption (SF) | Asking net rent ($/SF) |
|---|---|---|---|---|
| Central DuPage | 3.36% | 5.77% | 0 | $13.76 |
| Chicago South | 4.58% | 8.50% | 219,656 | $8.75 |
| Fox Valley | 4.60% | 6.43% | 709,371 | $6.96 |
| I-55 Corridor | 5.99% | 12.60% | 1,233,871 | $7.50 |
| I-57 Corridor | 5.14% | 10.27% | 0 | $6.76 |
| I-80 Corridor/Joliet | 4.49% | 8.17% | 156,296 | $7.18 |
| I-88 Corridor | 6.22% | 7.85% | 485,690 | $8.48 |
| Lake County | 4.88% | 6.62% | 336,192 | $7.32 |
| North Cook | 4.88% | 7.79% | 379,390 | $13.89 |
| North DuPage | 3.22% | 7.93% | 268,639 | $9.61 |
| North Kane | 3.79% | 7.32% | 531,178 | $7.72 |
| Northwest Cook | 5.86% | 8.30% | 58,295 | $10.95 |
| Northwest Indiana | 2.80% | 5.48% | 475,740 | $7.70 |
| O'Hare | 3.98% | 7.60% | 1,194,530 | $9.34 |
| South Cook | 5.87% | 8.22% | 76,156 | $7.39 |
| Southeast Wisconsin | 7.34% | 8.18% | 895,587 | $5.87 |
| Southwest Cook | 5.24% | 7.76% | 79,692 | $5.90 |
| West Cook | 7.67% | 10.30% | -292,656 | $9.78 |
 THE COMPLETE RESEARCH PUBLICATION
03 / THE FULL REPORT
44 pages of proprietary research on Chicago’s industrial market, from overall market indicators to submarket performance, major transactions and development activity.
PDF · 44 pages · 15.1 MB · Full report
LEE & ASSOCIATES MARKET RESEARCH
Connect with our research team for customized research and market intelligence.