
Houston Industrial Distribution | Market Report Q2 2026
Executive Summary
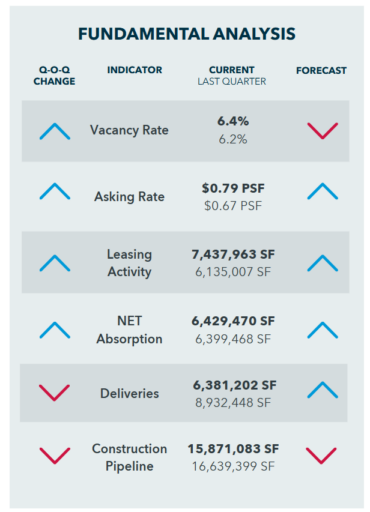
The Houston industrial distribution market continued to demonstrate remarkable resilience during the second quarter of 2026, reinforcing its position as one of the nation’s strongest logistics markets. While the pace of expansion has moderated from the record-setting levels experienced over the past several years, market fundamentals remain exceptionally healthy. Leasing activity strengthened during the quarter, asking rents reached a new cyclical high, and tenant demand continued to absorb recently delivered speculative space.
The market is clearly transitioning into a more balanced phase of the cycle. Vacancy has increased modestly as new projects come online, but current levels remain well within a healthy range and reflect the normal lease-up process rather than any deterioration in underlying demand. At the same time, developers have become more disciplined, with construction starts slowing and preleasing activity improving as new projects are increasingly aligned with tenant requirements.
Houston continues to benefit from long-term structural advantages that distinguish it from many competing markets. Continued growth at Port Houston, strategic access to national and international transportation networks, and a diverse regional economy continue to attract logistics, manufacturing, and distribution users. These fundamentals, combined with steady population and employment growth, provide a solid foundation for future industrial demand.
As we move through the remainder of 2026, I expect Houston’s industrial market to remain well positioned. Disciplined development, resilient tenant demand, and sustained economic growth should continue to support healthy leasing activity, stable market fundamentals, and long-term investment performance.
– Mary Doetterl, Research Director
Key Takeaways
- Asking rents reached a new cyclical high despite continued speculative deliveries.
The citywide weighted asking rate increased to $0.79 per square foot, demonstrating continued pricing power for well-located Class A distribution assets. - Supply and demand remain largely balanced as newly delivered space continues to lease.
Although deliveries slightly exceeded absorption during the quarter, vacancy increased only modestly, reflecting normal lease-up timing rather than weakening market fundamentals. - Leasing activity accelerated, led by Houston’s primary logistics corridors.
Quarterly leasing volume increased more than 20% from Q1 2026, with the Northwest, South, and Southeast submarkets accounting for nearly 60% of total activity. - Developers continue to take a more disciplined approach to new construction.
The construction pipeline declined modestly while preleasing improved, signaling greater alignment between future development and tenant demand. - Building functionality continues to drive pricing and tenant demand.
Modern rear-load and front-load facilities commanded the highest asking rents, while cross-dock buildings remained the preferred choice for large-scale logistics users. - Houston’s long-term industrial fundamentals remain exceptionally strong.
Steady tenant demand, moderating construction activity, continued Port of Houston growth, and healthy regional economic drivers position the market for continued stability through the balance of 2026.
Asking Rate vs. Vacancy Rate
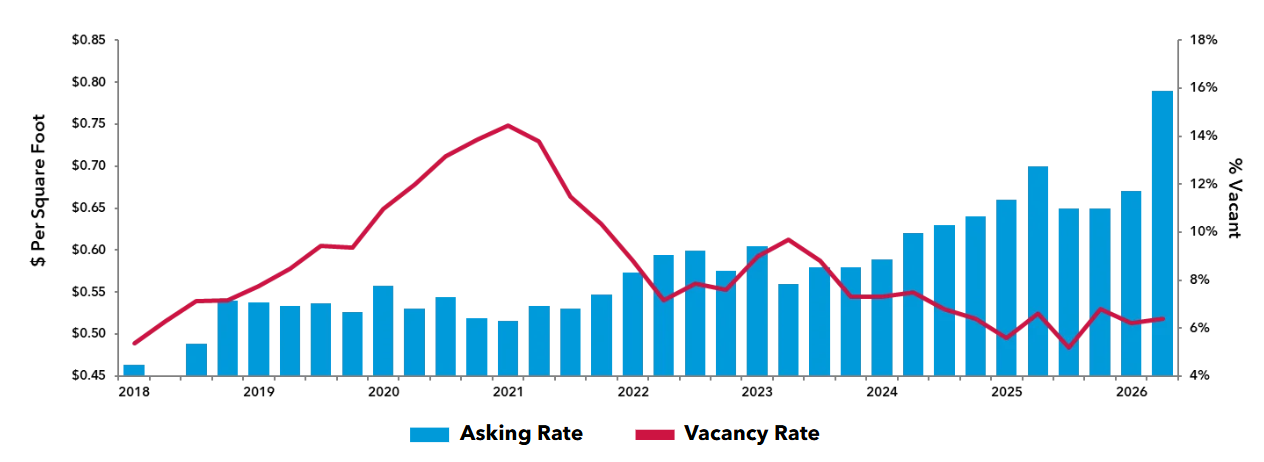
Houston’s industrial distribution market maintained healthy fundamentals during Q2 2026, with asking rents reaching a new cyclical high despite a modest increase in vacancy as recently delivered speculative space continued to enter the market. Average asking rates increased to $0.79 per square foot, up from $0.67 per square foot in Q1 2026, reflecting continued demand for well-located Class A distribution facilities and sustained landlord pricing discipline.
Direct vacancy increased slightly to 6.4%, up from 6.2% in the first quarter. While availability edged higher, vacancy remains well below historical averages and continues to reflect the gradual lease-up of new speculative development rather than weakening tenant demand. Leasing activity remains healthy, particularly for modern facilities offering efficient loading configurations and strong regional connectivity.
At the submarket level, the strongest rental performance continued to occur in the Southwest, North, and Northwest corridors, where newer inventory and superior transportation access supported above-average asking rates. Meanwhile, the Northeast remained the market’s most competitively priced submarket, while the Southeast continued to benefit from proximity to the Port of Houston and major logistics infrastructure.
Overall, Houston’s industrial market remains fundamentally sound, with modest vacancy increases being offset by continued rent growth and steady tenant demand. As new supply continues to be absorbed, owners of well-positioned distribution assets are expected to maintain favorable pricing through the remainder of 2026.
Net Absorption vs. Deliveries
What We’re Watching
- Lease-up progress of recent bulk deliveries
- Vacancy trends in the Northwest and North submarkets
- Balance between future deliveries and absorption
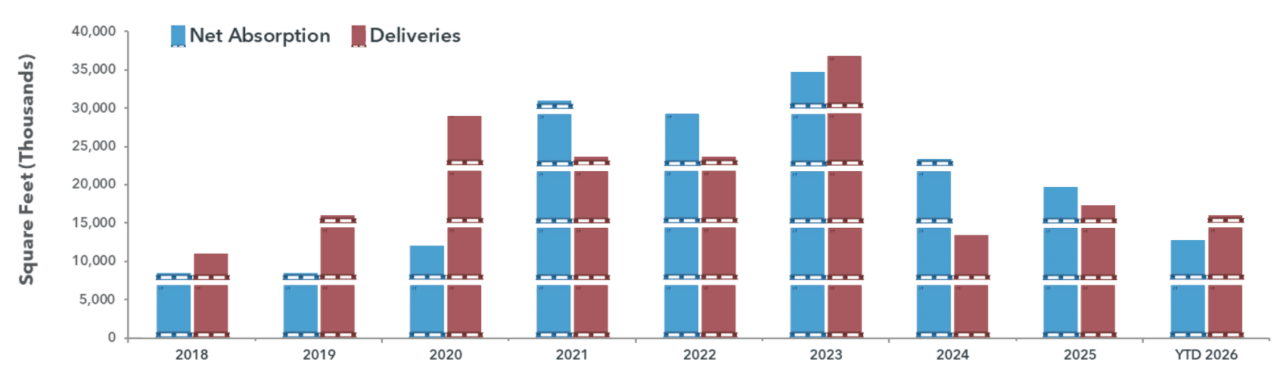
The Houston industrial distribution market maintained positive momentum in Q2 2026, supported by continued tenant activity and steady demand for modern logistics space. Net absorption totaled approximately 6.4 million square feet during the quarter, bringing year-to-date absorption to 12.8 million square feet. Absorption remained consistent with the strong pace established in Q1, reflecting resilient tenant demand and market fundamentals that remain aligned with normalized leasing activity.
Deliveries reached 6.4 million square feet during Q2 2026, increasing year-to-date completions to 15.3 million square feet. Although new supply continued to slightly outpace absorption on a year-to-date basis, quarterly demand effectively kept pace with deliveries. This dynamic contributed to only modest upward pressure on vacancy and continues to reflect the normal lease-up of recently completed speculative projects rather than any fundamental weakening in tenant demand.
On a year-to-date basis, absorption remains resilient, supported by occupiers in the logistics, manufacturing, and construction sectors. Demand continues to concentrate in Houston’s core distribution corridors, particularly near the Port of Houston and along major transportation routes. Near-term vacancy fluctuations are expected as additional projects deliver and stabilize, but current leasing trends continue to reflect healthy underlying market fundamentals.
Over the longer term, Houston’s industrial market has demonstrated its ability to absorb significant new supply. Since 2018, the market has added more than 185 million square feet of new industrial inventory, with strong cumulative absorption helping maintain long-term market balance. With the construction pipeline continuing to moderate and tenant demand remaining steady, the market is well positioned for continued stability through the balance of 2026.
Leasing Activity
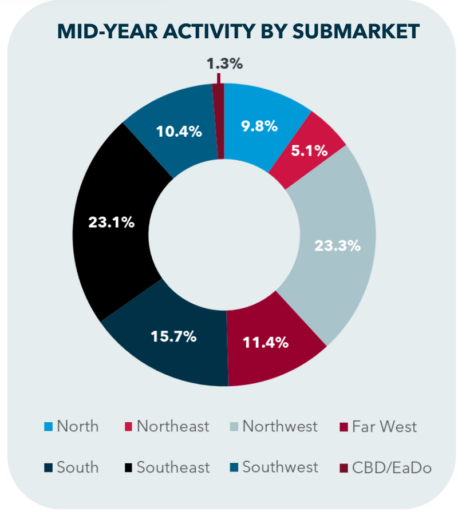 Houston’s industrial distribution market posted another strong quarter, with leasing activity totaling 7.4 million square feet, a 21.2% increase from the 6.1 million square feet recorded in Q1 2026. Year-to-date leasing reached 13.6 million square feet, reinforcing the market’s healthy demand fundamentals despite a more measured pace of economic growth.
- Leasing activity remained concentrated in Houston’s primary distribution corridors. The Northwest (22.1%), South (20.9%), and Southeast (15.9%) submarkets accounted for nearly 58.9% of all leasing volume during the quarter, reinforcing their importance as the region’s dominant logistics hubs. These areas continue to benefit from excellent highway connectivity, proximity to the Port of Houston, expanding population centers, and access to a growing labor force.
- Large-block leasing remained a defining trend throughout the quarter. Transactions exceeding 200,000 square feet represented approximately 19% of all leases but accounted for 64% of total leased square footage, demonstrating continued demand from major distributors, manufacturers, and third-party logistics (3PL) providers. At the same time, many occupiers continued to focus on optimizing their supply chain networks through consolidations, relocations, and selective expansions rather than aggressive footprint growth.
- Looking ahead, Houston’s industrial market remains well positioned. Healthy tenant demand, ongoing population and employment growth, and the region’s role as a premier logistics gateway should continue to support leasing activity, particularly for well-located, modern Class A distribution facilities.
Tenant Trends
- Occupiers continue prioritizing operational efficiency over expansion.
- Demand remains strongest for modern Class A distribution facilities.
- Large users continue favoring facilities with ample trailer parking and yard capacity.
Construction Pipeline
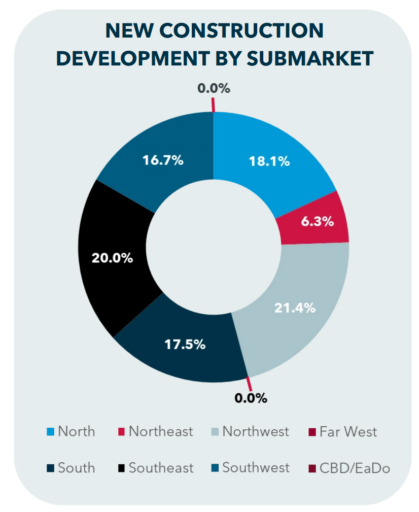 Houston’s industrial distribution development pipeline remained robust during the second quarter, with 15.9 million square feet under construction, compared with 16.6 million square feet in Q1 2026. The modest decline reflects a more disciplined pace of development as developers continue aligning new construction with tenant demand, leasing activity, and evolving capital market conditions.
- Construction activity remained concentrated in the Northwest (20.0%), Southeast (18.1%), and North (17.5%) submarkets, which together accounted for more than 55.6% of all industrial space currently under construction. These logistics corridors continue to attract development due to their strategic access to major transportation corridors, the Port of Houston, and expanding labor markets.
- New construction starts totaled approximately 5.0 million square feet during the quarter, down from 6.4 million square feet in Q1 2026, as developers responded to higher financing costs, rising construction expenses, and a more selective leasing environment. Despite fewer project starts, tenant commitment to new product improved, with the market’s aggregate preleasing rate increasing from 12.6% to 18.0%, reflecting continued demand for well-located, modern Class A distribution facilities.
- Although development activity has become more disciplined, Houston’s industrial market continues to perform at levels well above those experienced prior to the pandemic. Between 2018 and 2019, annual net absorption averaged approximately 8.1 million square feet, while annual deliveries averaged 13.6 million square feet. Through the first half of 2026, the market has already recorded 12.8 million square feet of net absorption and 15.3 million square feet of deliveries, surpassing those pre-pandemic annual averages. This continued balance between healthy tenant demand and disciplined new supply reinforces Houston’s position as one of the nation’s strongest and most resilient industrial distribution markets.
Load Configuration Analysis
(Weighted NNN, Asking Rate & Average Deal Size)
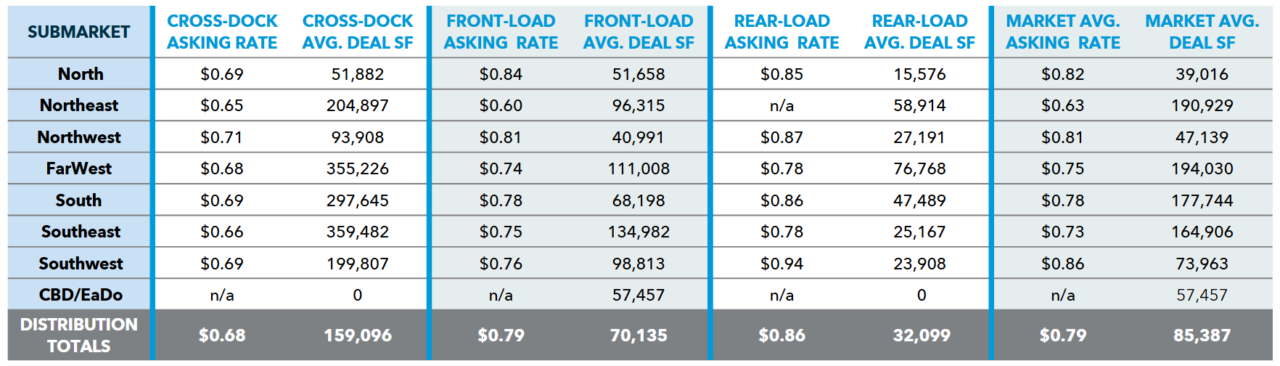
Houston’s industrial distribution market continued to demonstrate pricing stability during Q2 2026, with rents remaining supported despite elevated vacancy in portions of the market. While landlords continue competing for tenants in recently delivered speculative product, rental performance has remained resilient as demand favors functional Class A distribution facilities.
The market’s weighted average asking rate increased to $0.79 per square foot, up from $0.67 per square foot in Q1 2026, reflecting stronger pricing across nearly every building configuration. Average lease size moderated to approximately 85,387 square feet, indicating leasing activity broadened beyond large bulk transactions into more mid-sized occupancies. Annual rental escalations remain consistent, generally ranging between 3.50% and 3.75%.
Rear-load product posted the largest increase in rental rates, climbing from $0.72 per square foot in Q1 2026 to $0.86 per square foot in Q2 2026. Although these buildings continue to accommodate the smallest average deal sizes at 32,099 square feet, demand for infill locations serving local and regional distribution has allowed landlords to maintain premium pricing.
Front-load facilities experienced a similar improvement, with weighted asking rates increasing from $0.71 per square foot in Q1 2026 to $0.79 per square foot in Q2 2026. Average transaction size moderated slightly from 74,000 square feet to 70,100 square feet, reflecting continued demand from mid-sized distributors, light manufacturers, and service-oriented occupiers prioritizing operational flexibility.
Cross-dock facilities also recorded pricing gains, with weighted asking rates rising from $0.63 per square foot in Q1 2026 to $0.68 per square foot in Q2 2026. Despite remaining the lowest-priced configuration, cross-dock product continued to capture the market’s largest transactions, averaging 159,096 square feet. Demand remained concentrated among logistics providers, transportation companies, and large-scale distributors requiring efficient trailer circulation and high-throughput operations.
Overall, pricing remains more closely tied to building functionality and location than broader market conditions. Higher asking rates across all three loading configurations, despite ongoing speculative deliveries, suggest owners continue to achieve healthy rental performance for well-positioned assets. As leasing activity remains steady and new supply is absorbed, Houston’s industrial market is expected to maintain a disciplined pricing environment through the balance of 2026.
Submarket Rate Comparison
Weighted NNN, Asking Rate
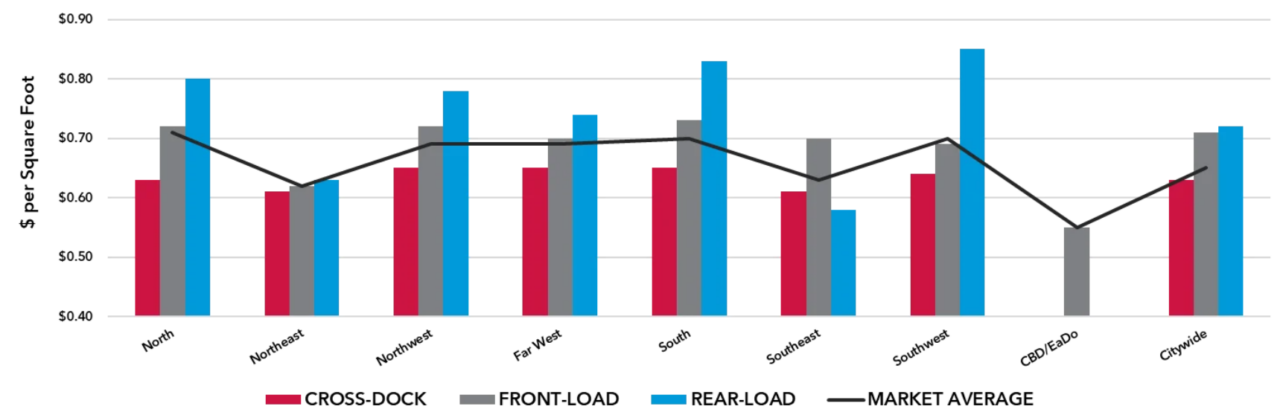
Asking rates strengthened in Q2 2026, with rent growth broadening across Houston’s industrial distribution submarkets as pricing remained closely tied to product quality and location.
Houston’s industrial distribution market recorded a citywide weighted NNN asking rate of $0.79 per square foot in Q2 2026, up from $0.67 per square foot in Q1 2026, reflecting stronger pricing across nearly every submarket despite continued speculative deliveries. The increase underscores continued demand for modern distribution space, particularly within Houston’s primary logistics corridors.
The Southwest submarket posted the market’s highest weighted asking rate at $0.86 per square foot, followed by the North ($0.82 per square foot), Northwest ($0.81 per square foot), and South ($0.78 per square foot). These submarkets continue to benefit from concentrations of modern Class A inventory, superior transportation access, and healthy leasing activity.
The Far West and Southeast submarkets recorded weighted asking rates of $0.75 per square foot and $0.73 per square foot, respectively, reflecting improving fundamentals as newer product continues to lease. The Northeast remained the market’s lowest-priced major distribution submarket at $0.63 per square foot, while industrial inventory within CBD/EaDo remains limited and not representative of the broader distribution market.
Across all submarkets, rear-load facilities continued to command the highest asking rents, while cross-dock assets remained the most competitively priced, reflecting the relationship between building configuration, tenant requirements, and operating efficiency. Overall, pricing continues to be driven more by asset quality and location than by broader market conditions, with well-positioned industrial properties maintaining healthy rental performance despite elevated vacancy in select areas.
Key Activities
| COMMENCEMENTS | |||
|---|---|---|---|
| TENANT | BUSINESS PARK | SQUARE FEET | SUBMARKET |
| Crane Worldwide Logistics | Twinwood Distribution Center | 767,520 | Far West |
| Sanmina Corporation | Constellation Eldridge | 537,375 | Northwest |
| Modular Power Solutions | Maverick Distribution | 435,680 | North |
| LEASING ACTIVITY | |||
| TENANT | BUSINESS PARK | SQUARE FEET | SUBMARKET |
| Applied Optoelectronics, Inc. | Hightower Business Park | 800,030 | Southwest |
| TAS Energy, Inc. | Carson 288 | 750,663 | South |
| Distribution Alternatives | Kingsland Ranch Logistics Park | 504,370 | Far West |
| SALE TRANSACTIONS | |||
| BUYER | SELLER | BUSINESS PARK | SQUARE FEET | SUBMARKET |
| QTS | Outrigger Industrial | 12515 Lockwood Road | 1,026,270 | Northeast |
| High Street Logistics Properties | TIAA | Northwest Spur Industrial Park (6 Bldgs) | 1,010,912 | Northwest |
| Goldman Sachs | Pinpoint Commercial | 22206 Beckendorf Road | 838,446 | Northwest |
| DELIVERIES | |||
| DEVELOPER / OWNER | BUSINESS PARK | SQUARE FEET | SUBMARKET |
| Alliance Industrial Partners | TriPort 8 Logistics Park | 881,521 | Southeast |
| Junction Commercial Real Estate | Junction Fairbanks | 445,246 | Northwest |
| Carson Companies | Carson Bay 10 | 439,330 | Southeast |
| CONSTRUCTION PIPELINE | |||
| DEVELOPER / OWNER | BUSINESS PARK | SQUARE FEET | SUBMARKET |
| Lovett Industrial | Southwest by South Logistics Center | 1,049,578 | Southwest |
| Transwestern Development Company | Innerbelt Northwest Logistics | 1,046,400 | Northwest |
| Prologis | Prologis Legacy Point | 1,002,406 | Northwest |
Overall Submarket Statistics
| SUBMARKET | INVENTORY (SF) |
DIRECT VACANCY RATE |
WEIGHTED NNN ASKING RATE(PSF) |
CURRENT QUARTER LEASING ACTIVITY (SF) |
YTD LEASING ACTIVITY (SF) |
CURRENT QUARTER NNN ABSORPTION (SF) |
YTD NNN ABSORPTION (SF) |
CURRENT QUARTER DELIVERIES (SF) |
% PRE- LEASED DELIVERIES |
CONSTRUCTION PIPELINE (SF) |
|---|---|---|---|---|---|---|---|---|---|---|
| NORTH | 66,918,958 | 5.3% | $0.82 | 1,006,186 | 1,326,527 | 1,079,310 | 1,615,087 | 1,074,889 | 0.0% | 2,877,298 |
| NORTHEAST | 25,068,527 | 7.4% | $0.63 | 215,376 | 692,095 | 139,720 | 707,629 | 330,030 | 0.0% | 1,002,017 |
| NORTHWEST | 90,531,434 | 5.9% | $0.81 | 1,645,440 | 3,158,311 | 1,849,696 | 4,342,580 | 1,430,567 | 0.0% | 3,396,632 |
| FAR WEST | 37,685,445 | 1.9% | $0.75 | 717,420 | 1,552,238 | 865,348 | 1,856,181 | 252,800 | 62.0% | 0 |
| SOUTH | 20,749,854 | 5.6% | $0.78 | 1,551,907 | 2,132,930 | 1,545,355 | 1,635,355 | 53,110 | 0.0% | 2,774,563 |
| SOUTHEAST | 86,256,476 | 11.3% | $0.73 | 1,181,647 | 3,133,207 | 633,308 | 1,964,052 | 2,241,859 | 3.3% | 3,175,710 |
| SOUTHWEST | 45,320,019 | 3.2% | $0.86 | 1,001,138 | 1,405,291 | 363,211 | 713,532 | 997,947 | 45.9% | 2,644,863 |
| CBD/EaDo | 4,266,774 | 6.6% | n/a | 118,849 | 172,371 | 53,522 | 94,522 | 0 | n/a | 0 |
| DISTRIBUTION TOTALS | 376,797,487 | 6.4% | $0.79 | 7,437,963 | 13,572,970 | 6,429,470 | 12,828,938 | 6,381,202 | 10.8% | 15,871,083 |
Outlook
Houston’s industrial market continues to demonstrate healthy fundamentals as it transitions into a more balanced phase of the cycle, with steady tenant demand supporting long-term stability despite an elevated level of recently delivered supply.
Houston’s industrial distribution market remains well positioned through the balance of 2026. The citywide weighted NNN asking rate increased to $0.79 per square foot, reflecting continued pricing strength for well-located Class A distribution facilities, while direct vacancy edged up modestly to 6.4% as newly completed speculative projects continue to lease. Current vacancy levels remain consistent with a healthy and growing market and reflect the timing of deliveries rather than any meaningful decline in tenant demand.
Demand continues to be driven by logistics, manufacturing, construction, and third-party logistics users, with Houston’s strategic transportation infrastructure and expanding population supporting long-term occupancy growth. The Southeast submarket is expected to remain a key source of industrial demand as Port Houston continues expanding cargo volumes, while the Northwest and South corridors continue attracting regional and national distributors seeking modern distribution space with excellent highway connectivity.
On the supply side, development activity has become increasingly disciplined. The construction pipeline continues to moderate, while higher preleasing levels and more selective project starts demonstrate that developers are aligning future deliveries more closely with tenant demand. This disciplined approach should help maintain long-term market balance as recently completed space is absorbed over the coming quarters.
Looking ahead, market performance is expected to remain increasingly differentiated by location and asset quality. Modern Class A facilities within Houston’s core logistics corridors should continue to outperform older inventory, with building functionality, transportation access, and operational efficiency remaining the primary drivers of leasing activity and rental growth.
Overall, Houston’s industrial distribution market is expected to maintain healthy fundamentals through the remainder of 2026, supported by steady absorption, disciplined development, continued Port Houston expansion, and resilient regional economic growth. These factors continue to reinforce Houston’s position as one of the nation’s premier industrial and logistics markets.
Key Risks & Opportunities
- Continued Port Houston expansion and supply chain diversification supporting long-term industrial demand.
- Near-term vacancy pressure as recently delivered speculative space continues to stabilize.
- Moderating development pipeline and improving preleasing levels helping maintain long-term market balance.
Sales Overview
Buyer Type by Submarket
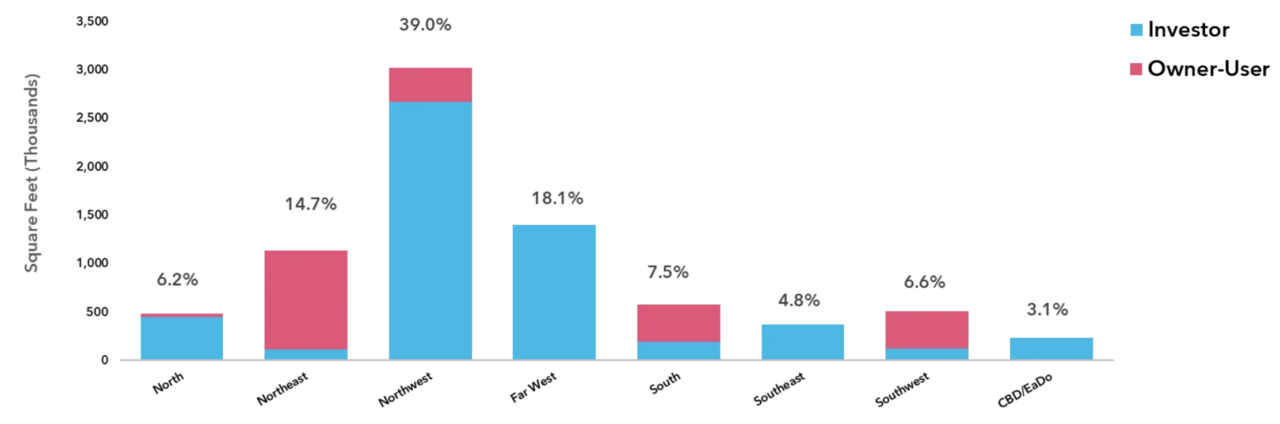
The industrial distribution market recorded approximately 7.7 million square feet of investment and owner-user sales activity during the quarter, reflecting continued investor interest despite a more selective capital environment. Institutional buyers remained the primary drivers of volume, accounting for 5.6 million square feet, while owner-user acquisitions totaled 2.2 million square feet, representing approximately 28% of quarterly sales activity.
Sales activity remained concentrated in the Northwest (3.0 million square feet), Far West (1.4 million square feet), and Northeast (1.1 million square feet) submarkets, which together accounted for approximately 72% of total quarterly sales volume. The Northwest continued to attract institutional capital seeking modern Class A distribution assets, while the Far West remained active with large-scale investment transactions. The Northeast emerged as the market’s leading owner-user destination, accounting for nearly half of all owner-user acquisitions during the quarter, driven primarily by a single 1.0 million-square-foot building sale.
Pricing remained relatively stable throughout the quarter, with cap rates holding firm as investors continue to target well-leased, high-quality assets. While capital remains selective, competition for core product persists, particularly in top-performing submarkets. Pricing is increasingly being set on an asset-by-asset basis, with differentiation between stabilized core assets and value-add opportunities becoming more pronounced. Buyer demand remains deepest for stabilized Class A assets, while value-add opportunities are experiencing wider bid-ask spreads and longer marketing timelines.
Overall, Houston continues to demonstrate strong liquidity and remains a highly competitive industrial investment market.
Historical Distribution Sales Price
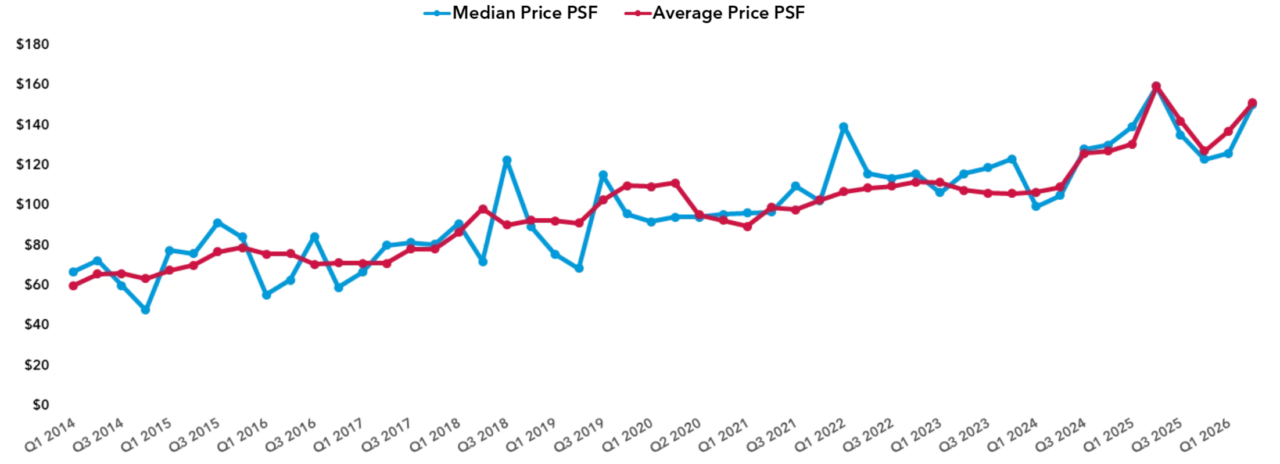
Over the past decade, Houston’s industrial distribution market has experienced substantial long-term price appreciation, supported by growing institutional investment, expanding tenant demand, and the region’s emergence as one of the nation’s premier logistics markets. While quarterly pricing has fluctuated in response to changing capital market conditions and transaction mix, the long-term trend remains decidedly upward.
Following record pricing during Q2 2025, average sale prices moderated through the second half of the year as investors adjusted to higher financing costs and a more selective acquisition environment. Despite this pullback, pricing remained well above historical averages, reflecting continued demand for institutional-quality industrial assets.
During Q2 2026, average sale prices rebounded to approximately $151 per square foot, up from $137 per square foot in Q1 2026. The improvement reflects continued competition for modern Class A distribution facilities, particularly those offering strong tenancy, strategic locations, and durable long-term cash flow. Pricing continues to vary by asset quality, lease profile, and location, with premium assets consistently commanding the strongest valuations.
Looking ahead, Houston’s industrial investment market remains well positioned. While investors continue underwriting acquisitions with greater discipline, resilient leasing fundamentals, moderating new construction, and sustained occupier demand should continue supporting historically strong pricing for high-quality industrial assets.
Economic Update
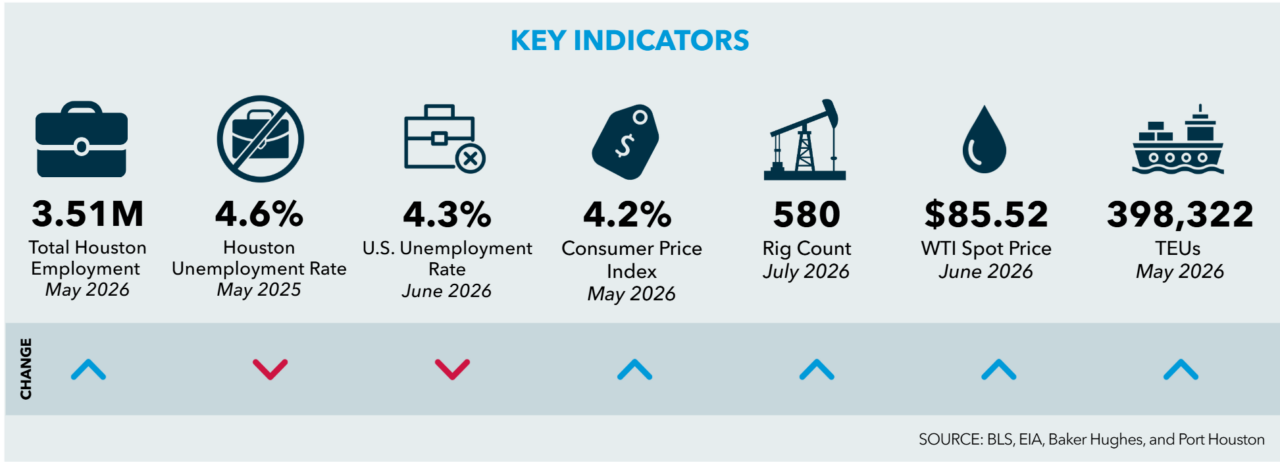
Houston’s economy remains resilient, supported by steady employment levels, moderate inflation, and continued strength in energy and trade-related activity.
Houston’s economic fundamentals remained healthy through mid-2026. Total employment reached 3.5 million in May 2026, while the local unemployment rate measured 4.6% in May 2026. The U.S. unemployment rate is 4.2% and consistent with historical averages. Labor market conditions continue to support business activity across the region.
Inflation remained above historical norms, with the Consumer Price Index increasing 4.2% year-over-year in May 2026, though price growth has generally stabilized compared to recent peaks. Houston’s energy sector remained a key economic driver, as WTI crude oil averaged $85.52 per barrel in June 2026 and the U.S. rig count totaled 580 in July 2026, supporting continued drilling and investment activity.
Trade and logistics also remained strong, with Port Houston handling 398,322 TEUs in May 2026, up from 381,640 TEUs in May 2025. Together, steady employment growth, resilient energy activity, and expanding trade volumes continue to provide a solid foundation for regional economic growth and industrial demand.
Industrial Employment Growth
Growth By Industry
April 2026 – Year-Over-Year Change
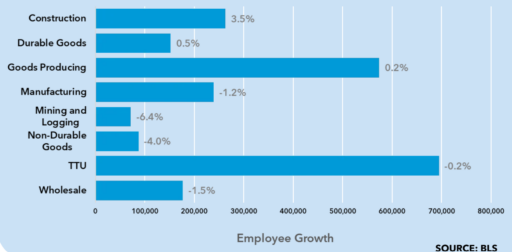
Construction continues to provide stability for Houston’s industrial economy, although manufacturing, logistics, and energy-related employment remain under pressure.
Houston’s industrial labor market remained mixed in April 2026. Construction employment increased 3.5% year over year to 262,700 jobs, reflecting continued development activity despite a slower economic environment. Overall goods-producing employment edged up 0.2%, supported by gains in durable goods manufacturing (0.5%).
Several industrially significant sectors continued to soften. Mining and Logging employment declined 6.4% to 71,800 jobs, while Manufacturing fell 1.2% to 238,900 jobs, driven by a 4.0% decrease in non-durable goods employment. Trade, Transportation, and Utilities employment slipped 0.2%, and Wholesale Trade declined 1.5%, pointing to moderating logistics and distribution activity.
Overall, continued strength in construction is helping offset softness across several industrial sectors, supporting a stable outlook for Houston’s industrial economy despite moderating hiring trends.
Employment Growth
APRIL 2026 – 10 Year Change
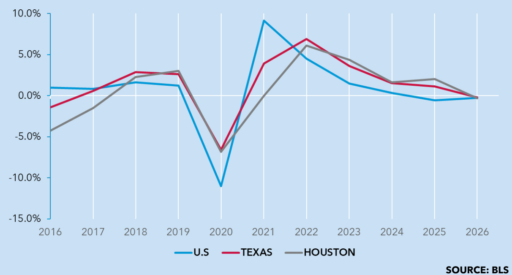
Houston’s industrial employment has transitioned from post-pandemic recovery to stabilization, with hiring easing after several years of above-average growth.
Over the past decade, Houston’s industrial employment trends have generally followed those of Texas and the U.S., though with greater volatility due to the region’s concentration in energy and manufacturing. Following employment declines in 2016 and 2017, industrial hiring accelerated in 2018 and 2019 as logistics, manufacturing, and energy-related activity strengthened.
The pandemic resulted in a 6.9% decline in Houston industrial employment in 2020. While hiring remained flat in 2021, momentum strengthened in 2022 and 2023, with employment growth reaching 6.1% and 4.4%, respectively. Growth moderated to 1.7% in 2024 and 2.0% in 2025 before edging down 0.3% in 2026, broadly in line with slowing state and national trends.
The recent moderation reflects the transition from a post-pandemic recovery to a more sustainable pace of hiring, supporting a stable long-term outlook for Houston’s industrial sector.
Port Houston Activity Update
Port Houston continued to demonstrate stable cargo performance through the second quarter of 2026 despite evolving global trade patterns. While trade policy changes, geopolitical uncertainty, and seasonal cargo fluctuations influenced shipping activity during the first half of the year, Port Houston maintained healthy container volumes and continued to benefit from its diversified cargo base and strategic Gulf Coast location.
Market Conditions
Through May 2026, Port Houston handled nearly 1.9 million TEUs, with May container volumes increasing 4% year over year. Although year-to-date growth remained relatively modest, container activity continues to reflect stable trade fundamentals following several years of exceptional expansion. This steady performance supports continued demand for logistics, manufacturing, and distribution facilities throughout Southeast Houston.
May 2026 – TEUs
Import 188,276
Export 190,195
Total 398,322
In May 2026, Port Houston processed 398,322 TEUs, representing a 4% increase year over year and a 13% increase from April, reflecting continued strength in container activity.
Market Signals
- Export activity remains resilient despite softer imports.
- Steel trade continues to reflect global market volatility.
- Container activity remains balanced across imports and exports.
Tonnage Performance
May 2025 vs. May 2026
| CATEGORY | IMPORT | EXPORT |
|---|---|---|
| General | DOWN 63% | DOWN 65% |
| Steel | DOWN 7% | DOWN 14% |
| Dry Bulk | UP 79% | DOWN 33% |
| Liquid Bulk | FLAT 0% | UP 8% |
| Container | UP 13% | UP 1% |
| TOTAL | UP 11% | UP 2% |
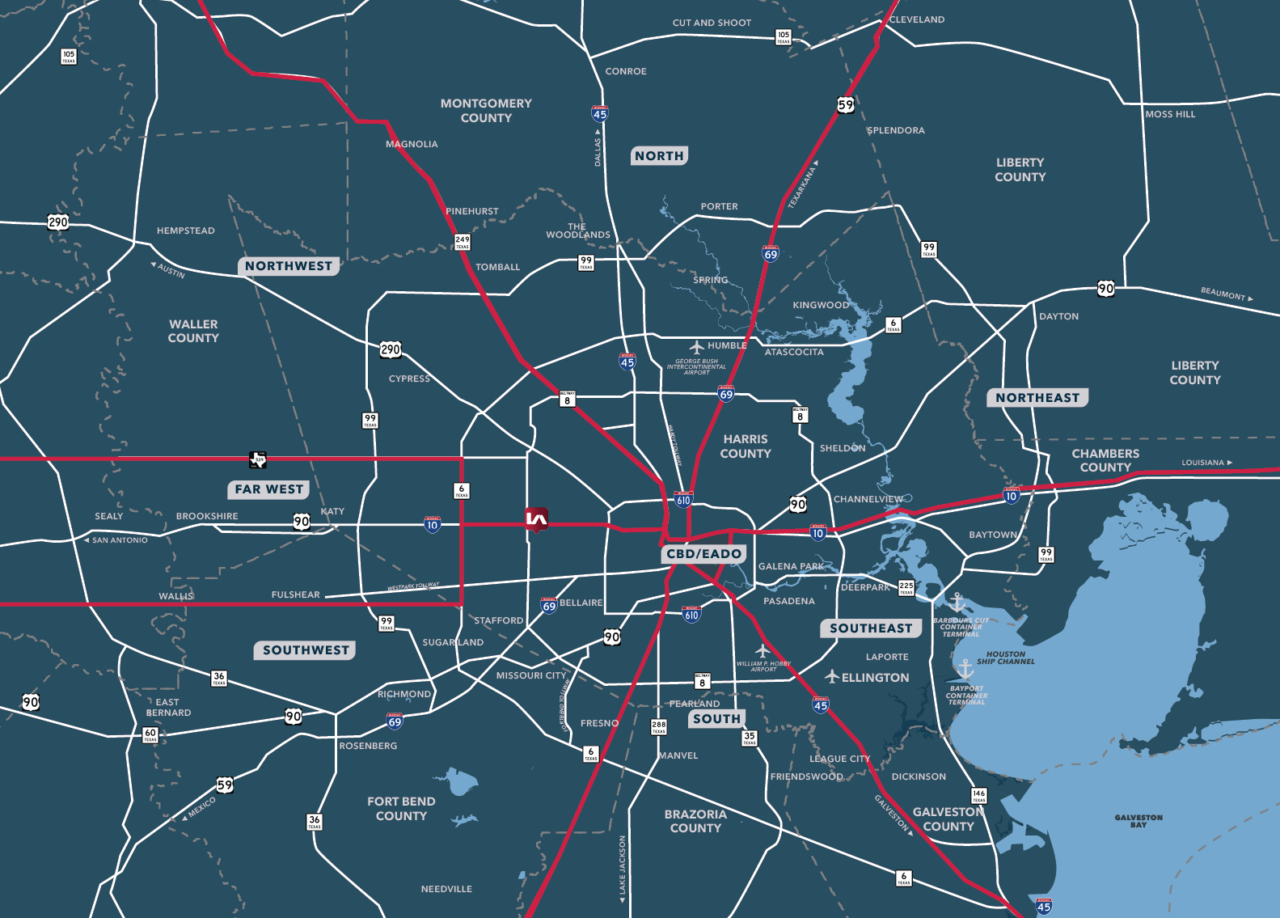
Houston Industrial Submarket Map
Research Team
- MARY DOETTERL | RESEARCH DIRECTOR | | [email protected]
- NATHAN KRUEGER | RESEARCH ANALYST
- JASMINE HUANG | JUNIOR RESEARCH ANALYST