
Port Houston | Market Report Q1 2026
OVERVIEW
Continued expansion and throughput growth remain key drivers of industrial demand across Southeast Houston
Port Houston: Driving Industrial and Logistics Demand
Port Houston remains a primary driver of Houston’s industrial market, supporting activity across logistics, distribution, import/export, and manufacturing sectors. Its scale, connectivity, and ongoing infrastructure investment continue to reinforce Houston’s role as a national freight hub, particularly across port-adjacent corridors.
Channel Capacity and Terminal Efficiency
Port Houston’s continued expansion and throughput growth remain a primary driver of industrial demand across Southeast Houston. Modern terminals and technology investments enhance throughput, supply chain visibility, and operational reliability. The 52-mile Houston Ship Channel, the busiest U.S. waterway by tonnage, moved 309.5 million short tons in 2023, or approximately 12% of total U.S. waterborne cargo. Port Houston also handled a record 4.14 million TEUs in 2024, underscoring its expanding role in global trade.
Market Conditions
Port-driven activity continues to anchor demand in Southeast Houston, the metro’s most port-oriented industrial submarket. As of Q1 2026, inventory totaled 82.8 million square feet, with a 7.8% vacancy rate and weighted NNN asking rents of $0.62 per square foot. Leasing and absorption remain supported by distribution and manufacturing users tied to port operations. With limited new construction underway, near-term performance will remain closely linked to port throughput and trade volumes.
Port Houston’s growth continues to translate directly into industrial demand, positioning Southeast Houston as one of the most strategically important logistics corridors in the U.S.
PORT HOUSTON
- 5th ranked U.S. container port by total TEUs
- Handles 73% of U.S. Gulf Coast container traffic
- Largest Texas port with 97% market share in containers
- Helps generate 979,500 Texas jobs from terminal activity
HOUSTON SHIP CHANNEL
- #1 Port for waterborne tonnage
- Largest U.S. petrochemical complex
- Supports 1.54M Texas jobs and 3.37M U.S. jobs
- Supports economic activity $439B Texas and $906B U.S.
Port and manufacturing driven demand and disciplined development continue to anchor Houston’s industrial market, with Southeast Houston remaining a key driver of long-term growth.
-Justin Tunnell, SIOR | Principal
PROJECT 11 AND TEU
PROJECT 11 UPDATE
Project 11, the Houston Ship Channel expansion, remains a key long-term infrastructure driver for Port Houston and the Southeast industrial submarket. The project is designed to deepen and widen the channel, improving vessel safety, transit efficiency, and capacity for larger ships.
Port Houston has indicated that roughly 70% of the project has been completed, with full completion currently expected in 2029. As additional segments come online, Project 11 is expected to strengthen Port Houston’s competitive position and support long-term demand for port-oriented industrial space, particularly among logistics, distributio
WHY PROJECT 11 MATTERS
- Expands channel capacity for larger vessels
- Improves safety and transit efficiency
- Supports long-term port competitiveness
- Reinforces demand for Southeast Houston industrial space
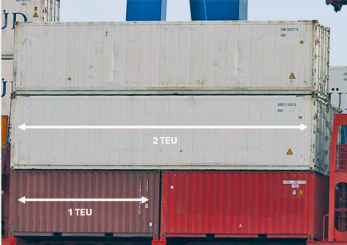
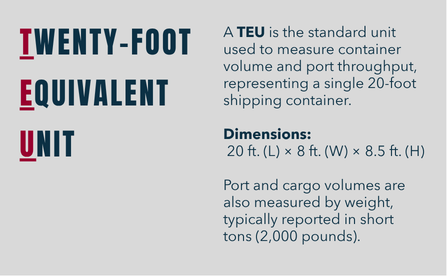
PORT HOUSTON TEUs
TEUs through February 2026 with Forecast
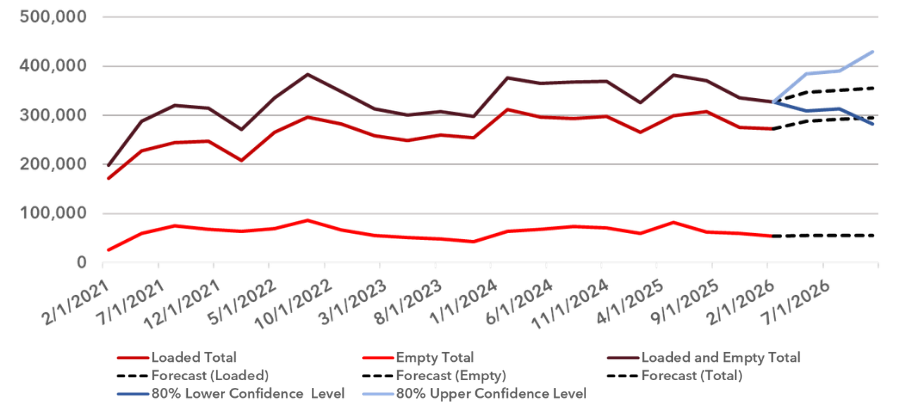
Port Houston continues to serve as a cornerstone of Houston’s industrial market, ranking among the nation’s leading container ports and capturing a significant share of Gulf Coast container traffic. Through February 2026, the port handled nearly 700,000 TEUs, a 4% year-over-year increase, demonstrating resilience relative to many national peers.
While volumes followed typical seasonal patterns, year-to-date activity reflects stable trade fundamentals supported by a diverse mix of imports and exports. Ongoing channel enhancements, terminal modernization, and strong regional connectivity position the port to remain competitive with major coastal gateways.
Looking ahead, port-driven industrial demand is expected to remain steady through 2026, with leasing and absorption in Southeast Houston closely aligned with TEU volumes, broader trade normalization, and manufacturing-related cargo flows. Sustained TEU growth continues to translate directly into demand for bulk distribution, cross-dock facilities, and port-proximate industrial space in Southeast Houston.
OVERALL SUBMARKET STATISTICS
WHAT COULD IMPACT PORT-DRIVEN DEMAND
- Tariff escalation or trade policy shifts
- Global shipping volatility / geopolitical risk
- Slower import volumes impacting warehouse demand
| SUBMARKET | INVENTORY (SF) |
DIRECT VACANCY RATE |
WEIGHTED NNN ASKING RATE(PSF) |
CURRENT QUARTER LEASING ACTIVITY (SF) |
YTD LEASING ACTIVITY (SF) |
CURRENT QUARTER NNN ABSORPTION (SF) |
YTD NNN ABSORPTION (SF) |
CURRENT QUARTER DELIVERIES (SF) |
% PRE- LEASED DELIVERIES |
CONSTRUCTION PIPELINE (SF) |
|---|---|---|---|---|---|---|---|---|---|---|
| SOUTHEAST | 83,265,602 | 8.90% | $0.63 | 1,855,870 | 1,855,870 | 1,330,744 | 1,330,744 | 144,459 | 16.30% | 5,123,532 |
| CITYWIDE TOTAL |
367,654,514 | 6.20% | $0.67 | 5,853,530 | 5,853,530 | 7,258,002 | 7,258,002 | 8,701,224 | 40.90% | 16,639,399 |
SOUTHEAST SUBMARKET
The Southeast Houston industrial submarket closed Q1 2026 with steady fundamentals, supported by its proximity to Port Houston and continued demand from logistics, distribution, and manufacturing users. Total inventory increased to approximately 83.3 million square feet, while the direct vacancy rate rose to 8.9% as new deliveries continue to come online. Weighted NNN asking rents averaged $0.63 per square foot, remaining competitive within the broader metro.
Leasing activity totaled approximately 1.9 million square feet, with net absorption reaching 1.3 million square feet—highlighting ongoing tenant demand despite a modest slowdown from prior quarters. Deliveries totaled 144,529 square feet, reflecting a steady development pipeline.
Development activity remains elevated, with approximately 5.1 million square feet under construction. While this underscores long-term confidence in the submarket, the pace of lease-up and vacancy movement will be key factors to monitor through 2026.
CITYWIDE MARKET
Across the Houston metro, industrial fundamentals remained balanced entering 2026, supported by steady demand and continued strength in port-related activity. Total inventory reached approximately 367.7 million square feet, with a direct vacancy rate of 6.2%.
Quarterly leasing activity totaled 5.9 million square feet, while net absorption reached 7.3 million square feet. Deliveries totaled 8.7 million square feet, reflecting an active development cycle.
Overall, the market continues to benefit from strong Port Houston activity, steady development, and durable tenant demand, with fundamentals gradually normalizing as new supply is absorbed.
MAJOR U.S. PORT UPDATE
TEUs Totals
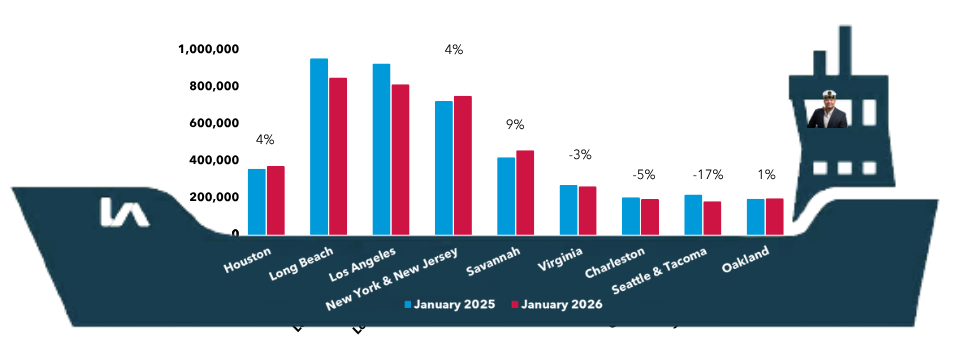
Port Houston continues to structurally gain share as Gulf and East Coast ports outperform West Coast gateways.
Major U.S. port activity in January 2026 reflected a continued shift in cargo flows, with Gulf and East Coast ports posting gains while several West Coast ports saw notable declines. Port Houston handled approximately 370,000 TEUs, representing a 4% year-over-year increase and reinforcing its steady growth trajectory.
Similarly, the Port of New York & New Jersey and Savannah recorded increases of 4% and 9%, respectively, highlighting sustained strength across eastern distribution corridors. In contrast, West Coast ports experienced declines, with Los Angeles
and Long Beach down 12% and 11%, respectively, while Seattle/Tacoma fell 17%.
This divergence reflects ongoing supply chain realignment and port diversification strategies. For Houston, continued volume growth supports its role as a key logistics hub, reinforcing long-term demand drivers for industrial distribution space across the region.
PORT HOUSTON ACTIVITY UPDATE
Market Signals
- Export-driven growth vs import softness
- Steel trade volatility
- TEU mix shifting toward exports
Year-End Market Dynamics and U.S. Port Trends
Start-of-Year Conditions and Trade Activity
Port Houston entered 2026 with steady performance, supported by strong export activity and stable overall cargo volumes. Steel exports increased while imports declined, reflecting shifting trade dynamics and potential tariff-related impacts.
U.S. Port Performance and Coastal Trends – Through February 2026
Through the first two months of 2026, five of the nine largest U.S. ports reported year-over-year declines in TEU volume, indicating broader softness across global trade flows. These trends are likely influenced by a combination of tariff pressures and geopolitical factors, contributing to uneven performance across major gateways.
Shift in Coastal Port Leadership
East Coast and Gulf Coast ports outperformed their West Coast counterparts on a year-over-year basis, marking a notable shift in cargo distribution patterns. The Ports of Los Angeles and Long Beach posted declines of 12% and 11%, respectively, while the Port of Savannah led the nation in growth. The Port of Seattle recorded the sharpest decline at 17%, highlighting continued volatility across Pacific gateways.
Port Houston Activity
Port Houston continues to demonstrate steady performance entering 2026, supported by strong export activity and stable cargo volumes.
TEU Volume:
In February 2025, the Port Houston processed over 326K TEUs, marking a 4% increase year-over-year.
Year-Over-Year Performance
(February 2025/2026)
Steel Imports: -23%
Steel Exports: 2,093%
General Imports: +8%
General Exports: +14%
ALL Imports & Exports: +6%
Year-to-Date Performance
(January - February 2026)
Steel Imports: -30%
Steel Exports: +462%
TEU Empty Imports: +14%
TEU Empty Exports: +32%
ALL Imports & Exports: +6%

INTERNATIONAL IMPORT TRADE
Overview – Port Houston
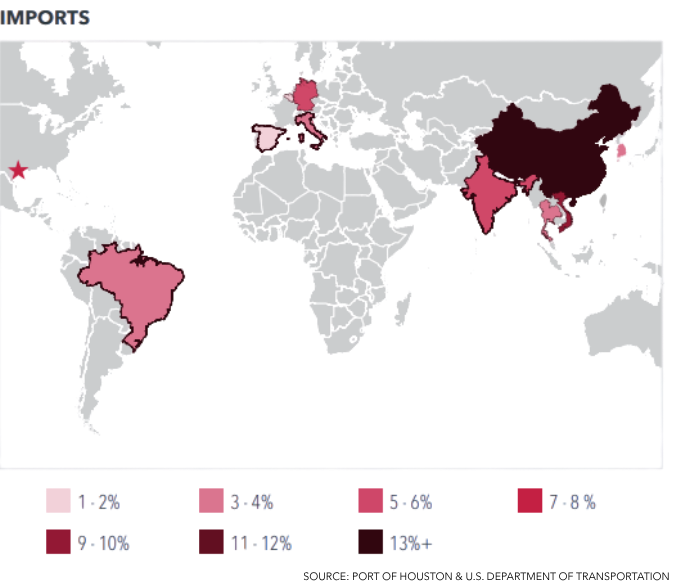
Port Houston serves as a critical global gateway, connecting the U.S. to key trade partners across Asia and Europe while supporting resilient, diversified supply chains.
Import Dynamics
Top Trade Partners
China leads by volume, accounting for 34.5% of inbound cargo, while Mexico leads by weight, exceeding 16 billion pounds in 2025.
Key Commodities
Machinery (18.4%) remains the largest import category, supporting manufacturing, energy, and industrial operations. Consumer goods (15.5%) continue to drive retail distribution and domestic demand.
Strategic Importance
Import activity supports domestic production capacity and reinforces Houston’s role as a key distribution hub for essential goods.
Emerging Trends
Since 2024, Vietnam is the only major trade partner to record an increase in import tonnage through Port Houston, highlighting evolving supply chain patterns.
INTERNATIONAL EXPORT TRADE
Export Dynamics
Regional Distribution
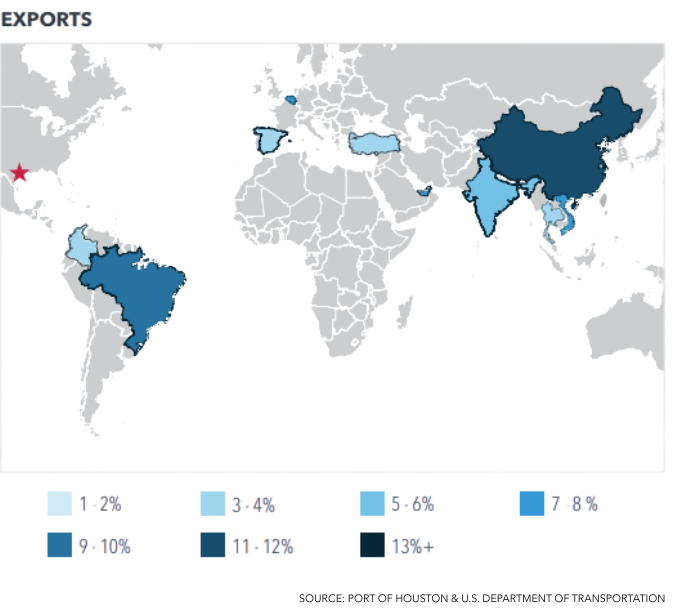
Exports are broadly distributed, with Europe receiving 24.4% of outbound cargo and Far Asia accounting for 23.6%, including 11.2% to China. This contrasts with the more concentrated nature of import activity.
Top Commodities
Resins and plastics (44.8%) dominate export volumes, supporting global manufacturing, packaging, and industrial applications.
Trade Balance Insights
Petrochemical exports significantly exceed imports (44.8% vs. 7.6%), while retail goods remain import-driven (1.5% of exports vs. 15.5% of imports), highlighting Houston’s role in global production and domestic consumption.
Strategic Significance
Houston’s trade profile reflects a balance between high-volume imports and diversified exports, reinforcing its position as a leading industrial and logistics hub supporting both regional and national economic activity.
FOREIGN TRADE ZONE
A Foreign Trade Zone (FTZ) is a designated area that U.S. Customs and Border Protection treats as outside U.S. customs territory for tariff and duty purposes. This designation provides companies engaged in international trade with greater operational flexibility and potential cost advantages, supporting trade, logistics, and manufacturing activity within the U.S.
Key Benefits
- Merchandise may enter the zone without formal customs entry
- Duties and certain federal taxes are assessed only when goods enter U.S. commerce
- No duties are paid on goods that are re-exported
- Potential relief from select quotas and trade restrictions, depending on product type
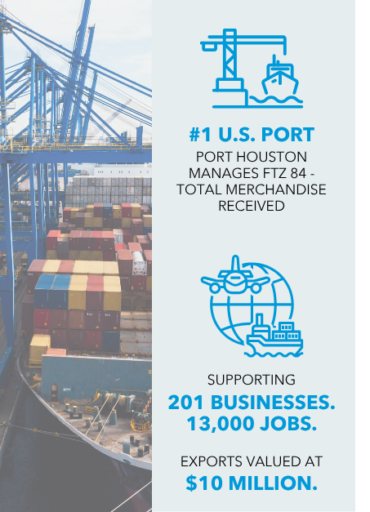
Port Houston FTZ 84
FTZ 84 encompasses Port Houston and is one of the largest FTZ networks in the United States, supporting logistics, distribution, manufacturing, petrochemical, and energy industries.
Companies operating within FTZ 84 benefit from:
- Duty and tariff efficiencies, including elimination of duties on re-exported goods
- Streamlined customs processing and improved inventory control
- Direct access to the Houston Ship Channel and strong regional connectivity via highway, rail, and air cargo networks
How It Works
- Goods entering an FTZ are not immediately subject to U.S. customs duties
- Duties are paid only when goods leave the zone and enter U.S. commerce
- Goods exported directly from the FTZ are not subject to U.S. duties
KEY TAKEAWAYS FOR INDUSTRIAL REAL ESTATE
- Port growth is translating directly into sustained leasing demand across Southeast Houston, particularly for bulk distribution and cross-dock facilities.
- The Southeast submarket continues to outperform the broader Houston market, driven by proximity to Port Houston and limited competing supply.
- Tenant demand remains strongest for large-scale, logistics-oriented facilities, with users prioritizing efficiency, access, and throughput.
- Project 11 will further enhance long-term port capacity, supporting continued industrial growth and reinforcing Houston’s position as a leading U.S. logistics hub.
ABOUT LEE & ASSOCIATES
INDUSTRIAL ADVISORS
MIKE SPEARS, SIOR,CCIM
MANAGING PRINCIPAL
MASON ALSBROOKS, SIOR, CCIM
EXECUTIVE PRINCIPAL
THOMAS LEGER, SIOR
EXECUTIVE PRINCIPAL
PRESTON YAGGI, SIOR,CCIM
EXECUTIVE PRINCIPAL
CHASE CRIBBS, SIOR
PRINCIPAL
RICHARD GLASS, SIOR
PRINCIPAL
JUSTIN TUNNELL, SIOR
PRINCIPAL
PATRICK WOLFORD, SIOR, CCIM
PRINCIPAL
STEPHEN KUPER
VICE PRESIDENT
CLINT HANKLA
SENIOR DIRECTOR
AUSTIN DABBS
DIRECTOR
MATTHEW CLAY
DIRECTOR
TROY COLLINS
DIRECTOR
ANDRES CREXIELL
DIRECTOR
JASON ENGLISH
DIRECTOR
JOHN GAZZOLA
DIRECTOR
JEFF KUPER
DIRECTOR
THOMAS MONAGHAN
DIRECTOR
STUART PETERSON
DIRECTOR
CONRAD CHAMBERS
ASSOCIATE
MATT JORGENSEN
ASSOCIATE
TANNER KINCANNON
ASSOCIATE
ANDREW MCGUIRE
ASSOCIATE
MARCO MILOSAVLJEVIC
ASSOCIATE
FELIPE RODRIGUEZ
ASSOCIATE
CHASE TAYLOR
ASSOCIATE
OFFICE ADVISORS
CHRIS LEWIS, SIOR
MANAGING PARTNER
BILL INSULL, CCIM
PRINCIPAL
DREW LEWIS
PRINCIPAL
TRAVIS TAYLOR
PRINCIPAL
BLAKE R. VIRGILIO, SIOR, CCIM
PRINCIPAL
WADE BOWLIN
EXECUTIVE VICE PRESIDENT
COURTNEY BUCKOUT
DIRECTOR
BLAINE SINCLAIR
DIRECTOR
JEFF CHARBONNEAU
ASSOCIATE
ERIK JORGENSEN
ASSOCIATE
MAX WELCH
ASSOCIATE
RETAIL ADVISORS
BRANDI DEES
SENIOR VICE PRESIDENT
MCKAILY CARPENTER
ASSOCIATE
LOCAL EXPERTISE. INTERNATIONAL REACH.
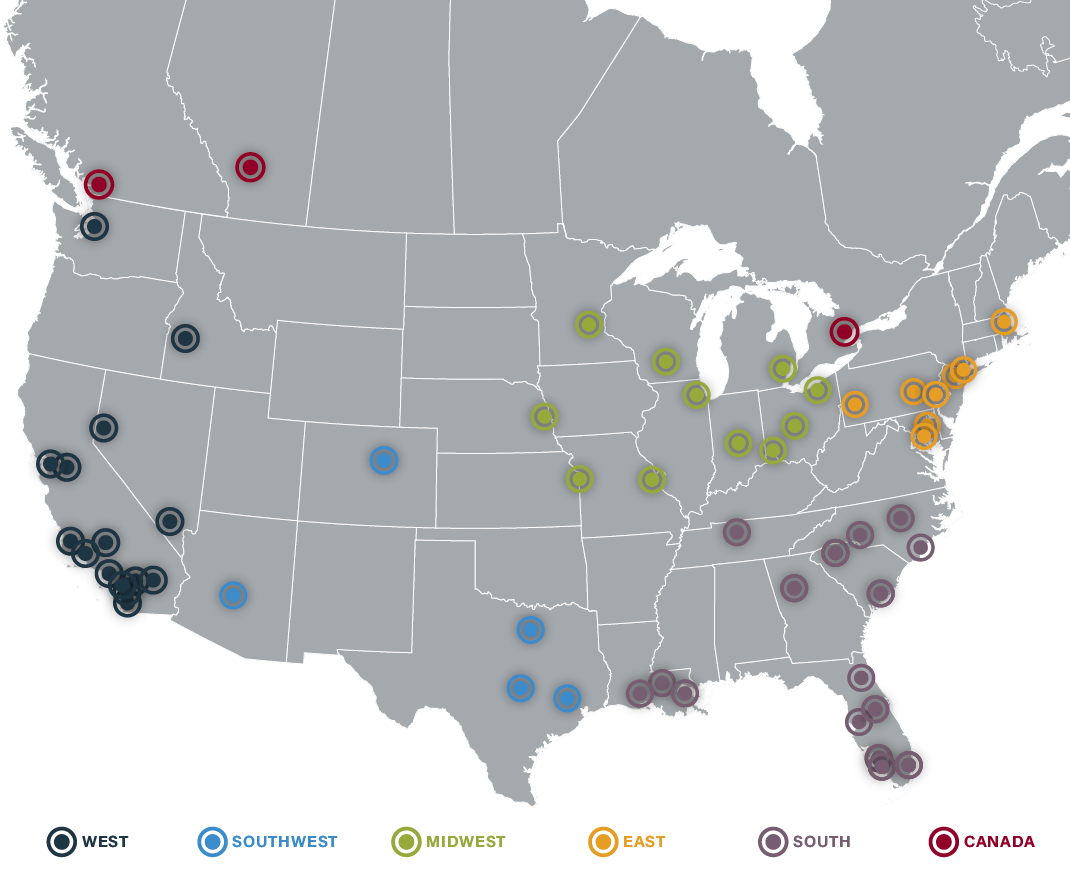
With offices in 85+ markets across North America, Lee & Associates has the ability to deliver first-class services to our clients both locally and internationally.
THE LEE ADVANTAGE
Lee & Associates – Houston is a fully-integrated commercial real estate company with unrivaled market knowledge and an unwavering commitment to integrity and excellence. Our business-minded brokers specialize in office, industrial, and land real estate investments. The brokerage is uniquely qualified to support our client’s real estate needs in Houston, across Texas, and throughout the US.
RESEARCH TEAM
- MARY DOETTERL | RESEARCH DIRECTOR | [email protected]
- NATHAN KRUEGER | RESEARCH ANALYST
- JASMINE HUANG | JUNIOR RESEARCH ANALYST