
Houston Industrial Distribution | Market Report Q3 2026
EXECUTIVE SUMMARY
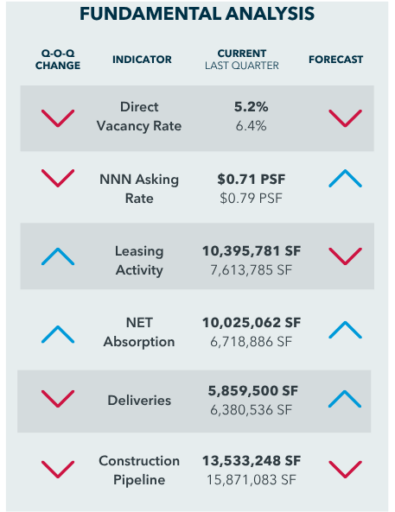
Houston’s industrial distribution market delivered a record-breaking third quarter of 2026, demonstrating the remarkable depth and resilience of tenant demand across the region. Q3 2026 net absorption reached a record 10.0 million square feet, while leasing activity climbed to a record 10.4 million square feet, marking an exceptional quarter for Houston’s industrial market.
The momentum was equally impressive compared with Q2 2026. Net absorption increased approximately 49% quarter over quarter, while leasing activity increased approximately 37%. Year-to-date absorption reached 23.1 million square feet, moving ahead of the 21.4 million square feet delivered through September 2026 and demonstrating Houston’s ability to absorb substantial new supply.
Direct vacancy improved significantly, declining 120 basis points from 6.4% to 5.2%. Southeast Houston led quarterly leasing activity with 3.4 million square feet, followed by the Northwest submarket with 2.3 million square feet, reinforcing continued demand throughout Houston’s major logistics corridors.
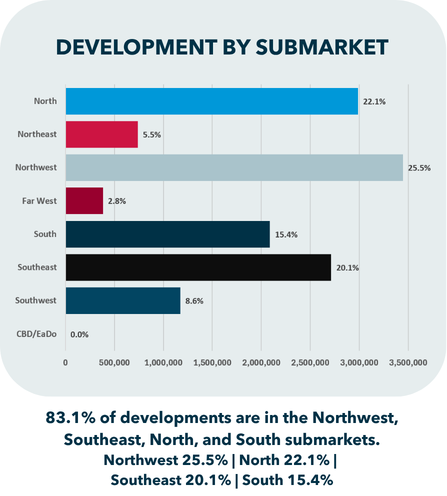
Development remains active but increasingly disciplined, with 13.5 million square feet currently under construction. The Northwest submarket accounts for 25.5% of the pipeline, followed by the North submarket at 22.1%, the Southeast submarket at 20.1%, and the South submarket at 15.4%. Combined, these four major industrial corridors represent 83.1% of all space under construction, reflecting continued developer focus on locations with established tenant demand and strong transportation infrastructure.
As a Houstonian and someone who has followed this market for many years, I’m excited to see this level of activity. Houston enters Q4 2026 with record demand, improving occupancy fundamentals, an activity development pipeline, and a diverse economic base supporting continued industrial growth.
- Mary Doetterl, Research Director
Demand remains strong.
Supply is becoming more disciplined.
Houston is still growing.
KEY TAKEAWAYS
Houston delivered a record-breaking quarter for industrial demand.
Q3 2026 net absorption reached a record 10.0 million square feet, while leasing activity climbed to a record 10.4 million square feet, demonstrating exceptional tenant demand across Houston’s industrial distribution market.
Absorption moved ahead of new supply.
Year-to-date net absorption reached 23.1 million square feet, surpassing the 21.4 million square feet delivered through September 2026. This marks an important shift from the first half of 2026, when deliveries were running ahead of absorption.
Vacancy declined significantly as recently delivered space continued to lease.
Direct vacancy fell 120 basis points, from 6.4% in Q2 2026 to 5.2% in Q3 2026, reinforcing strong demand despite substantial new supply entering the market.
Houston’s major logistics corridors captured most leasing activity.
The Southeast submarket led Q3 2026 with approximately 3.4 million square feet, or 33% of quarterly leasing, followed by the Northwest submarket with 2.3 million square feet, or 23%. Combined, the two submarkets accounted for approximately 56% of Q3 2026 leasing activity.
Development remains active, with new construction concentrated in Houston’s major industrial corridors.
Approximately 13.5 million square feet is currently under construction. The Northwest submarket accounts for 25.5% of the pipeline, followed by the North submarket at 22.1%, Southeast submarket at 20.1%, and South submarket at 15.4%. Combined, these four submarkets represent approximately 83% of all space under construction, reflecting continued developer focus on locations with established tenant demand and strong transportation infrastructure.
ASKING RATE VS VACANCY RATE
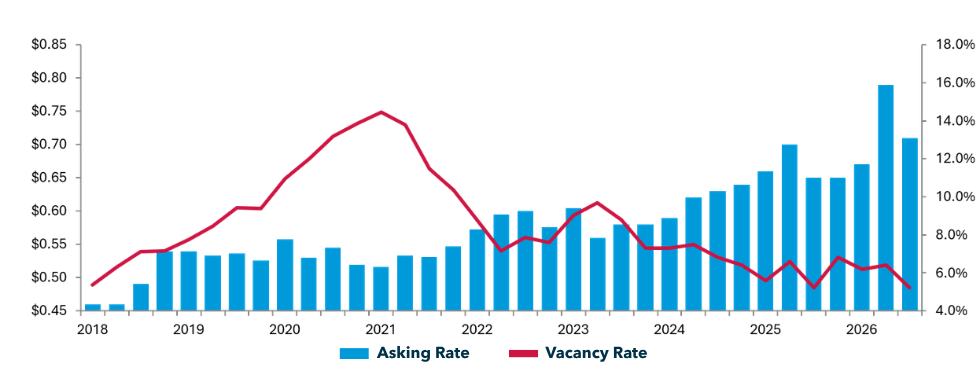
Vacancy declined sharply in Q3 2026 as record tenant demand accelerated the absorption of available industrial space.
Houston’s industrial distribution market recorded a significant improvement in occupancy fundamentals during Q3 2026. Direct vacancy declined 120 basis points to 5.2%, down from 6.4% in Q2 2026, as record net absorption and leasing activity helped absorb recently delivered speculative space.
The citywide weighted NNN asking rate measured $0.71 per square foot during Q3 2026. Weighted asking rates are based on available properties with disclosed pricing in LeeSearch and can shift based on building configuration, location, available block size, and the mix of properties being marketed. Annual rental escalations generally remain in the 3.5% to 4.0% range, providing continued rent growth across the market.
At the submarket level, the Southwest and Far West submarkets recorded the highest weighted asking rates at $0.74 per square foot, followed closely by the North, Northwest, and South submarkets at $0.73 per square foot. The Southeast submarket averaged $0.68 per square foot, while the Northeast submarket remained the lowest-priced major distribution submarket at $0.64 per square foot.
Overall, Q3 2026 reflects strengthening occupancy fundamentals rather than broad-based pricing weakness. Record leasing and absorption, combined with declining vacancy, demonstrate continued demand as Houston works through recently delivered inventory. Building quality, configuration, location, and available block size remain important drivers of asking rates across the market.
NET ABSORPTION VS DELIVERIES
WHAT WE'RE WATCHING
-
Whether absorption can maintain its elevated pace following an exceptional Q3 2026
-
Continued lease-up of recently delivered speculative space as vacancy declines
-
Whether moderating construction creates a tighter supply-demand environment entering 2027
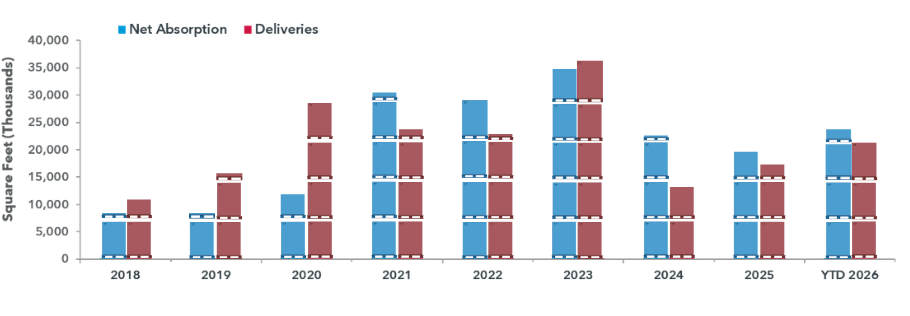
Record absorption pushed demand ahead of new supply during Q3 2026, marking an important shift in Houston’s industrial distribution market.
Houston’s industrial distribution market recorded a record 10.0 million square feet of net absorption in Q3 2026, up about 49% from 6.7 million square feet in Q2 2026 and marking the strongest quarterly performance on record. Year-to-date net absorption reached 23.1 million square feet, already exceeding the 19.8 million square feet recorded during all of 2025.
Deliveries totaled approximately 5.9 million square feet during Q3 2026, bringing year-to-date completions to 21.4 million square feet. For the first time this year, cumulative absorption surpassed deliveries, with demand now exceeding new supply by about 1.7 million square feet.
This shift contributed to the decline in direct vacancy from 6.4% in Q2 2026 to 5.2% in Q3 2026.
The Southeast submarket led Houston with approximately 3.7 million square feet of Q3 2026 net absorption, followed by the Southwest submarket at 1.5 million square feet, the Northwest submarket at 1.5 million square feet, and the South submarket at 1.3 million square feet. Together, these four submarkets accounted for approximately 80% of quarterly absorption, demonstrating strong demand across multiple Houston industrial corridors.
With record absorption, declining vacancy, and year-to-date demand now exceeding deliveries, Houston enters Q4 2026 with a considerably healthier balance between new supply and tenant demand.
LEASING ACTIVITY
Tenant demand accelerated significantly during Q3 2026, pushing quarterly leasing activity to an all-time high and reinforcing Houston’s position as a major distribution and logistics hub.
Leasing activity reached a record 10.4 million square feet in Q3 2026, up about 37% from 7.6 million square feet in Q2 2026. Year-to-date leasing activity climbed to 24.2 million square feet, with demand spanning distribution, logistics, manufacturing, and other industrial users.
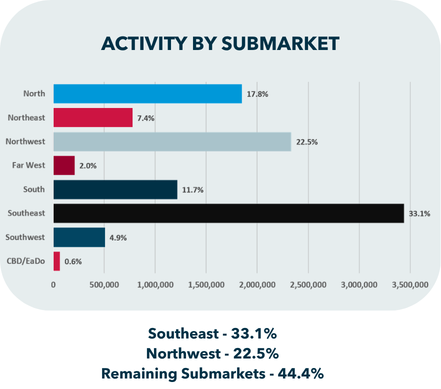
Activity was concentrated within Houston’s major logistics corridors. The Southeast submarket led with approximately 3.4 million square feet, representing 33% of Q3 2026 leasing activity, followed by the Northwest submarket with approximately 2.3 million square feet, or 23%. The North submarket contributed another 1.9 million square feet, or 18%. Together, these three submarkets accounted for approximately 74% of quarterly leasing activity.
Large transactions played a significant role in the Southeast submarket’s performance. Tesla leased 1.2 million square feet at TGS Cedar Port Logistics Park and an additional 800,405 square feet at Cedar Port Logistics Center, while Spike Electric leased 643,118 square feet at Bayport South Business Park. These transactions reinforce the appeal of Southeast Houston for large industrial users seeking Port Houston access, transportation infrastructure, and modern logistics facilities.
While large-block transactions drove headline volume, leasing remained geographically diverse, with the South, Northeast, Southwest, Far West, and CBD/EaDo submarkets collectively contributing approximately 2.8 million square feet during Q3 2026.
TENANT TRENDS
- Record demand: Q3 2026 leasing reached 10.4 million square feet, the highest quarterly total on record.
- Large-block activity: Modern Class A facilities remain a preferred option for major distribution, manufacturing, and logistics users.
- Location matters: Port access, highway connectivity, labor availability, and proximity to population growth continue to influence tenant location decisions.
CONSTRUCTION PIPELINE
Development activity remains strong, with approximately 13.5 million square feet under construction across Houston’s industrial distribution market.
Leasing activity reached a record 10.4 million square feet in Q3 2026, up about 37% from 7.6 million square feet in Q2 2026. Year-to-date leasing activity climbed to 24.2 million square feet, with demand spanning distribution, logistics, manufacturing, and other industrial users.
Activity was concentrated within Houston’s major logistics corridors. The Southeast submarket led with approximately 3.4 million square feet, representing 33% of Q3 2026 leasing activity, followed by the Northwest submarket with approximately 2.3 million square feet, or 23%. The North submarket contributed another 1.9 million square feet, or 18%. Together, these three submarkets accounted for approximately 74% of quarterly leasing activity.
Large transactions played a significant role in the Southeast submarket’s performance. Tesla leased 1.2 million square feet at TGS Cedar Port Logistics Park and an additional 800,405 square feet at Cedar Port Logistics Center, while Spike Electric leased 643,118 square feet at Bayport South Business Park. These transactions reinforce the appeal of Southeast Houston for large industrial users seeking Port Houston access, transportation infrastructure, and modern logistics facilities.
While large-block transactions drove headline volume, leasing remained geographically diverse, with the South, Northeast, Southwest, Far West, and CBD/EaDo submarkets collectively contributing approximately 2.8 million square feet during Q3 2026.
The Northwest submarket now represents the largest share of the construction pipeline at approximately 3.4 million square feet, or 25.5%, followed by the North submarket at 3.0 million square feet, or 22.1%, the Southeast submarket at 2.7 million square feet, or 20.1%, and the South submarket at 2.1 million square feet, or 15.4%. Combined, these four submarkets account for approximately 83% of all industrial distribution space currently under construction.
The concentration of development within Houston’s major industrial corridors reflects continued developer confidence in locations supported by established tenant demand, transportation infrastructure, population growth, and access to major employment centers. At the same time, higher construction and capital costs, infrastructure requirements, and longer stabilization periods continue to encourage greater selectivity in new development decisions.
The recent movement of additional projects from proposed to under construction demonstrates that Houston’s development cycle remains active. With record leasing and net absorption during Q3 2026, developers continue to advance projects while balancing future supply with available inventory and evolving tenant requirements.
LOAD CONFIGURATION ANALYSIS
(Weighted NNN, Asking Rate & Average Deal Size)
| SUBMARKET | CROSS-DOCK ASKING RATE |
CROSS-DOCK AVG. DEAL SF |
FRONT-LOAD ASKING RATE |
FRONT-LOAD AVG. DEAL SF |
REAR-LOAD ASKING RATE |
REAR-LOAD AVG. DEAL SF |
MARKET AVG. ASKING RATE |
MARKET AVG. DEAL SF |
|---|---|---|---|---|---|---|---|---|
| North | $0.58 | 85,986 | $0.74 | 42,668 | $0.84 | 23,250 | $0.73 | 57,396 |
| Northeast | $0.66 | 279,999 | $0.64 | 72,691 | $0.49 | 54,144 | $0.64 | 109,165 |
| Northwest | $0.69 | 135,233 | $0.72 | 36,508 | $0.84 | 33,066 | $0.73 | 59,785 |
| FarWest | $0.69 | 355,226 | $0.83 | 80,076 | $0.73 | 58,995 | $0.74 | 135,464 |
| South | $0.66 | 347,233 | $0.77 | 91,294 | $0.79 | 47,489 | $0.73 | 204,005 |
| Southeast | $0.68 | 472,748 | $0.68 | 159,912 | $0.67 | 29,973 | $0.68 | 201,538 |
| Southwest | $0.67 | 209,720 | $0.72 | 82,365 | $0.81 | 19,081 | $0.74 | 70,762 |
| CBD/EaDo | n/a | 0 | n/a | 47,274 | n/a | 0 | n/a | 47,274 |
| DISTRIBUTION TOTALS |
$0.67 | 193,900 | $0.72 | 66,423 | $0.77 | 32,049 | $0.71 | 93,610 |
Building configuration continued to play a significant role in both pricing and tenant size during Q3 2026, with a clear relationship between weighted NNN asking rates and average deal size.
The citywide weighted NNN asking rate averaged $0.71 per square foot during Q3 2026, while the average deal size was approximately 93,600 square feet. Tenant requirements varied considerably by loading configuration, reinforcing the importance of building functionality, location, and operational needs.
Rear-load facilities continued to command the highest weighted NNN asking rate at $0.77 per square foot, while accommodating the smallest average deal size at approximately 32,000 square feet. The North and Northwest submarkets recorded the highest rear-load rates at $0.84 per square foot, followed by the Southwest submarket at $0.81 per square foot.
Front-load facilities averaged $0.72 per square foot, with an average deal size of approximately 66,400 square feet. The Far West submarket recorded the highest front-load rate at $0.83 per square foot, followed by the South submarket at $0.77 per square foot.
Cross-dock facilities recorded the lowest weighted NNN asking rate at $0.67 per square foot but accommodated significantly larger transactions, averaging approximately 193,900 square feet. Average cross-dock deal size reached approximately 472,700 square feet in the Southeast submarket and 355,200 square feet in the Far West submarket, illustrating the scale requirements of major logistics and distribution users.
Overall, Q3 2026 reinforces a consistent relationship: smaller rear-load facilities generally command higher rates, while larger cross-dock facilities offer lower rates but accommodate substantially larger occupancies.
SUBMARKET RATE COMPARISON
(Weighted NNN, Asking Rate)
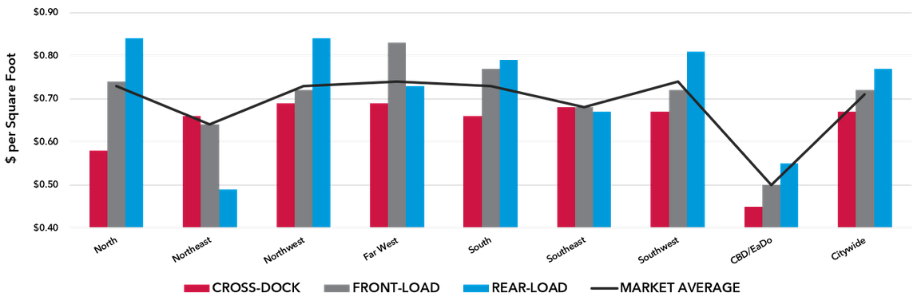
Weighted NNN asking rates remained well supported during Q3 2026, with pricing across Houston’s major industrial distribution submarkets continuing to reflect location, building configuration, and available block size.
The citywide weighted NNN asking rate averaged $0.71 per square foot during Q3 2026. While asking rates vary considerably by individual property and configuration, annual rental escalations generally remain in the 3.5% to 4.0% range, providing continued rent growth across the market.
The Southwest and Far West submarkets recorded the highest market-average weighted NNN asking rates at $0.74 per square foot, followed closely by the North, Northwest, and South submarkets at $0.73 per square foot. The relatively narrow pricing range across these major industrial corridors highlights the importance of individual asset characteristics in determining asking rates.
The Southeast submarket averaged $0.68 per square foot despite leading Houston in Q3 2026 leasing activity and net absorption. The submarket continues to benefit from Port Houston, Cedar Port, major transportation infrastructure, and a concentration of large cross-dock facilities. Its lower weighted asking rate primarily reflects product mix and larger available block sizes rather than weaker tenant demand.
Pricing differences also vary by building configuration. Rear-load rates reached $0.84 per square foot in both the North and Northwest submarkets, while the Far West submarket led front-load pricing at $0.83 per square foot. Cross-dock pricing remained more competitive, consistent with the substantially larger occupancies associated with this configuration.
Overall, Q3 2026 reinforces that submarket averages tell only part of the pricing story. Building configuration, available block size, location, and tenant requirements remain important pricing differentiators.
KEY ACTIVITIES
| COMMENCEMENTS | |||
| TENANT | BUSINESS PARK | SQUARE FEET | SUBMARKET |
|---|---|---|---|
| Grainger | Grainger Distribution Center | 1,281,280 | Northwest |
| Tesla | TGS Cedar Port Logistics Park | 1,218,956 | Southeast |
| Tesla | Cedar Port Logistics Center | 800,405 | Southeast |
| LEASING ACTIVITY | |||
| TENANT | BUSINESS PARK | SQUARE FEET | SUBMARKET |
| Tesla | TGS Cedar Port Logistics Park | 1,218,956 | Southeast |
| Tesla | Cedar Port Logistics Center | 800,405 | Southeast |
| Spike Electric | Bayport South Business Park | 643,118 | Southeast |
| SALE TRANSACTIONS | |||
| BUYER | SELLER | BUSINESS PARK | SQUARE FEET | SUBMARKET |
| INDUS Realty Trust | Equus Capital Partners | Park 845 Crossing | 702,814 | North |
| EQT | Thackeray Partners | Beltway 35 Business Park | 589,280 | South |
| Confidential | Constellation Real Estate | Constellation Eldridge | 537,375 | Northwest |
| DELIVERIES | |||
| DEVELOPER / OWNER | BUSINESS PARK | SQUARE FEET | SUBMARKET |
| Hines | Grainger Distribution Center | 1,281,280 | Northwest |
| Hillwood | Pinnacle Logistics Park | 1,209,589 | Northwest |
| Alliance Industrial Partners | TriPort 8 Logistics Park | 881,521 | Southeast |
| CONSTRUCTION PIPELINE | |||
| DEVELOPER / OWNER | BUSINESS PARK | SQUARE FEET | SUBMARKET |
| Lovett Industrial | Southwest by South Logistics Center | 1,049,578 | Southwest |
| Prologis | Prologis Legacy Point | 1,002,406 | Northwest |
| Hillwood | Goose Creek Commerce Center | 768,858 | Southeast |
OVERALL SUBMARKET STATISTICS
| SUBMARKET | INVENTORY (SF) |
DIRECT VACANCY RATE |
WEIGHTED NNN ASKING RATE (PSF) |
CURRENT QUARTER LEASING ACTIVITY (SF) |
YTD LEASING ACTIVITY (SF) |
CURRENT QUARTER NNN ABSORPTION (SF) |
YTD NNN ABSORPTION (SF) |
CURRENT QUARTER DELIVERIES (SF) |
% PRE- LEASED DELIVERIES |
CONSTRUCTION PIPELINE (SF) |
|---|---|---|---|---|---|---|---|---|---|---|
| NORTH | 68,091,165 | 5.7% | $0.73 | 1,850,504 | 3,271,571 | 1,160,503 | 2,775,590 | 1,166,147 | 0.0% | 2,987,317 |
| NORTHEAST | 25,437,863 | 5.8% | $0.64 | 776,434 | 1,528,312 | (111,050) | 596,579 | 262,336 | 0.0% | 739,681 |
| NORTHWEST | 90,999,983 | 4.6% | $0.73 | 2,335,637 | 5,619,813 | 1,145,470 | 6,060,876 | 940,887 | 45.6% | 3,447,218 |
| FAR WEST | 37,360,513 | 1.5% | $0.74 | 208,795 | 1,761,033 | 876,770 | 2,676,095 | 0 | n/a | 382,702 |
| SOUTH | 21,906,628 | 4.7% | $0.73 | 1,215,354 | 3,468,089 | 305,445 | 2,932,791 | 843,514 | 47.4% | 2,088,349 |
| SOUTHEAST | 87,584,025 | 7.6% | $0.68 | 3,439,769 | 6,449,228 | 3,745,113 | 5,780,027 | 1,215,317 | 69.2% | 2,714,463 |
| SOUTHWEST | 46,751,318 | 3.9% | $0.74 | 505,288 | 1,910,579 | 1,511,940 | 2,225,472 | 1,431,299 | 55.9% | 1,173,518 |
| CBD/EaDo | 4,266,774 | 6.0% | n/a | 64,000 | 236,371 | 101,464 | 195,986 | 0 | n/a | 0 |
| DISTRIBUTION TOTALS |
382,398,269 | 5.2% | $0.71 | 10,395,781 | 24,244,996 | 8,735,655 | 23,143,416 | 5,859,500 | 42.2% | 13,533,248 |
OUTLOOK
Key Risks & Opportunities
- Opportunity: Record leasing and absorption demonstrate continued tenant demand across Houston’s industrial market.
- Opportunity: Port Houston, manufacturing growth, population expansion, and major transportation infrastructure continue to support long-term industrial demand.
- Opportunity: Strong absorption and continued lease-up of recently delivered space could further improve the supply-demand balance.
- Risk: Higher capital, construction, infrastructure, and labor costs may affect development economics and future project timing.
- Watch: How the 13.5 million-square-foot construction pipeline progresses as developers balance record tenant demand with available inventory and evolving space requirements.
Record demand, improving occupancy, and an active development pipeline are creating a healthier balance between new supply and tenant activity as Houston enters Q4 2026.
Following a record third quarter, Houston’s industrial distribution market enters the final months of 2026 with considerable momentum. Q3 2026 net absorption reached 10.0 million square feet, pushing year-to-date absorption to 23.1 million square feet, ahead of the 21.4 million square feet delivered through September. Direct vacancy declined to 5.2%, demonstrating the market’s ability to absorb substantial new supply.
Demand remains broad-based across distribution, logistics, manufacturing, construction, and other industrial users. The Southeast submarket emerged as the quarter’s primary demand driver, while the Northwest submarket remained a major logistics corridor. Activity across Houston’s other submarkets provides additional depth beyond the market’s largest transactions.
Development remains active, with approximately 13.5 million square feet currently under construction. The Northwest, North, Southeast, and South submarkets account for approximately 83% of the pipeline, reflecting continued developer focus on Houston’s major industrial corridors. While projects continue to advance, higher capital and construction costs, infrastructure requirements, available inventory, and longer stabilization periods are encouraging greater selectivity in development decisions.
Looking ahead, performance will continue to vary by location, building configuration, and asset quality. Modern facilities offering efficient loading, transportation access, adequate power, and operational flexibility should remain well positioned.
Houston enters Q4 2026 with record demand, improving vacancy, active development, and a diversified economic base providing a strong foundation heading into 2027.
SALES OVERVIEW
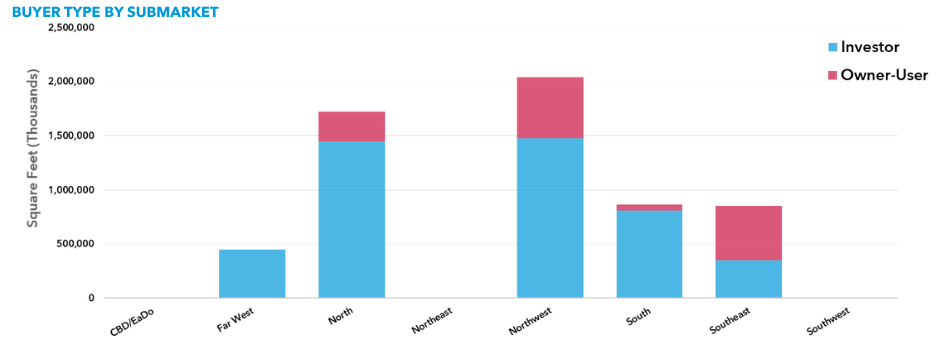
Approximately 5.9 million square feet of industrial distribution properties traded during Q3 2026. Investor acquisitions totaled approximately 4.5 million square feet, while owner-user acquisitions accounted for approximately 1.4 million square feet, indicating that investor demand represented the majority of transaction volume during the quarter.
The Northwest submarket led Q3 2026 sales activity with approximately 2.0 million square feet, or 34% of total volume, followed by the North submarket with approximately 1.7 million square feet, or 29%. The South submarket accounted for approximately 866,000 square feet, or 15%, while the Southeast submarket contributed approximately 851,000 square feet, or 14%. The Far West submarket represented an additional 452,000 square feet, or 8% of total activity.
Buyer composition varied by submarket. Investor acquisitions accounted for the majority of activity in the Northwest, North, South, Southeast, and Far West submarkets. The Northwest recorded approximately 1.5 million square feet of investor acquisitions and 564,000 square feet of owner-user acquisitions, while the North recorded approximately 1.4 million square feet of investor activity and 275,000 square feet of owner-user acquisitions. The Southeast also saw meaningful owner-user participation, with approximately 502,000 square feet acquired by occupiers compared with 349,000 square feet of investor acquisitions.
Overall, Q3 2026 reflected strong transaction activity across Houston's industrial market, with sales concentrated primarily in the Northwest and North submarkets, which together accounted for approximately 63% of total volume. While investors drove the majority of overall activity, owner-users remained active in several key corridors, providing additional depth to Houston's industrial sales market.
SALES OVERVIEW
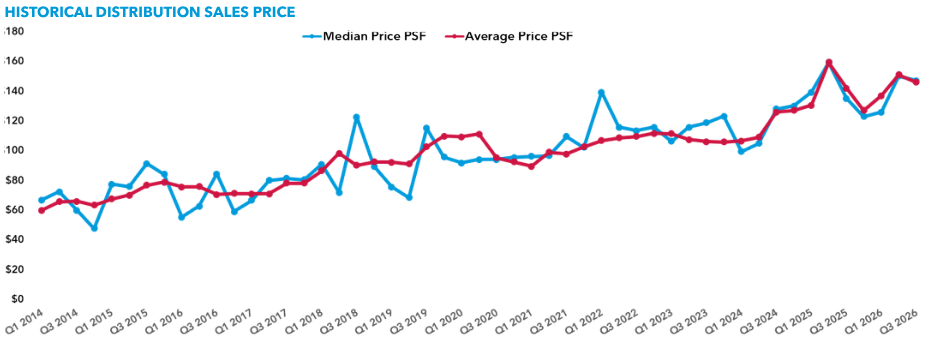
Industrial distribution sales pricing remained historically elevated during Q3 2026, supported by continued competition for quality assets and healthy demand from both investors and owner-users.
Industrial distribution sales pricing remained elevated during Q3 2026, despite moderating from the recent peak recorded in Q2.
The average sales price decreased to approximately $146 per square foot during Q3 2026, down from $151 per square foot in Q2 2026, but remained above the $137 per square foot recorded in Q1 2026. The median sales price declined to approximately $147 per square foot, compared with $150 per square foot in Q2, while remaining well above historical levels.
The longer-term trend remains notable. Industrial distribution sales values have appreciated substantially from pre-pandemic levels, with the Q3 2026 average of $146 per square foot well above the levels generally recorded throughout the 2010s and early 2020s. Rising replacement costs, continued demand for strategically located industrial properties, and Houston’s position as a major distribution, logistics, and manufacturing market have contributed to the sustained increase in valuations.
Despite the moderation from Q2, Q3 2026 pricing remained historically elevated. The combination of an average sales price of $146 per square foot and continued transaction activity across Houston’s major industrial corridors indicates that buyers remain active in the market, particularly for quality industrial product.
ECONOMIC UPDATE
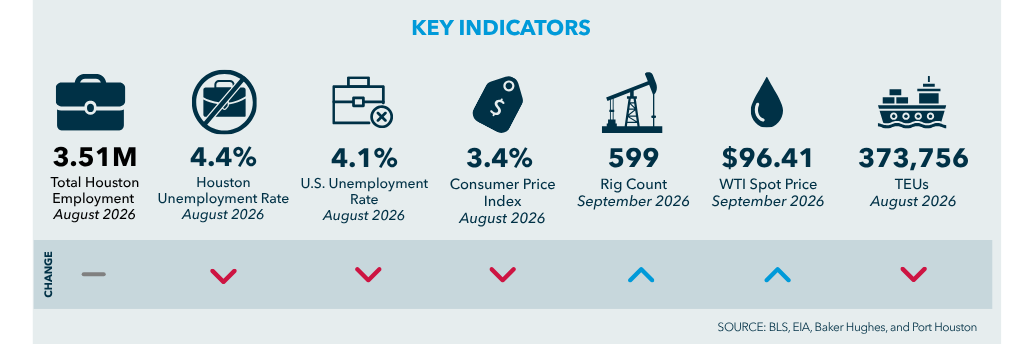
Houston's economy remained stable through Q3 2026, supported by a large employment base, moderating unemployment, continued energy activity, and steady trade volumes.
Houston’s economy remained stable through the third quarter of 2026, providing a supportive backdrop for continued industrial activity. Total Houston MSA employment reached approximately 3.51 million jobs in August 2026, while the unemployment rate stood at 4.4%. The U.S. unemployment rate measured 4.1% during the same period.
Inflation remained an important economic indicator, with the Consumer Price Index at 3.4% year over year in August 2026.
Houston’s energy sector also remained a key part of the regional economy, with WTI crude oil at $96.41 per barrel in September 2026 and the U.S. rig count totaling 599.
Trade activity remained steady, with Port Houston handling 373,756 TEUs in August 2026, compared with 370,430 TEUs in August 2025. Continued cargo activity reinforces Houston’s role as a major logistics gateway and supports distribution, manufacturing, and transportation-related real estate demand.
Overall, Houston’s large employment base, energy activity, population growth, and international trade continue to provide a diversified economic foundation for the region’s industrial market.
INDUSTRIAL EMPLOYMENT GROWTH
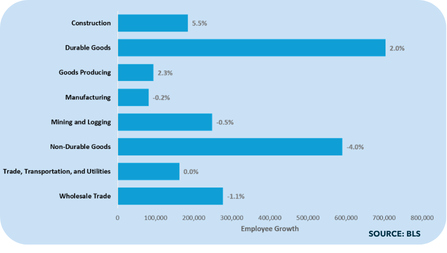
GROWTH BY INDUSTRY
SEPTEMBER 2026 - YEAR-OVER-YEAR CHANGE
Houston’s industrial employment remained relatively stable through August 2026, with strong construction growth offsetting modest declines across several other industrial-related sectors.
Construction continued to lead Houston’s industrial employment growth, increasing 5.5% year over year to approximately 269,000 jobs. The gain represents the strongest growth among the industrial sectors tracked.
Manufacturing employment remained essentially stable, declining just 0.2% year over year to approximately 240,400 jobs. Within the sector, Non-Durable Goods employment declined 4.0%. Mining and Logging employment decreased 0.5% to approximately 73,300 jobs, while Trade, Transportation and Utilities remained unchanged year over year. Wholesale Trade declined 1.1%.
Overall, the employment data reflects a mixed but relatively stable industrial labor market, with significant construction growth balancing modest declines across several other sectors. Houston’s diverse industrial employment base continues to support the region’s broader economy.
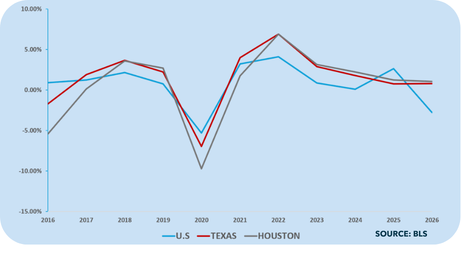
EMPLOYMENT GROWTH
SEPTEMBER 2026 - 10 YEAR CHANGE
Houston's employment growth has moderated from the rapid post-pandemic expansion but continues to track broadly with Texas and remain resilient relative to longer-term trends.
Over the past decade, Houston's employment growth has generally followed broader trends in Texas and the United States, with periods of stronger and weaker expansion reflecting shifts in economic conditions. The pandemic created a significant disruption in 2020, when Houston industrial employment declined 6.9%.
Employment growth strengthened during the recovery, reaching 6.1% in 2022 and 4.4% in 2023. Growth moderated to 1.7% in 2024 and 2.0% in 2025 before edging down 0.3% in 2026, reflecting a transition toward a more sustainable pace of employment growth.
While employment growth has moderated across Houston, Texas, and the U.S., Houston's diverse economy and continued population growth provide a broad base for ongoing business activity. The current trend suggests employment growth is normalizing after the exceptional expansion seen immediately after the pandemic.
PORT HOUSTON ACTIVITY UPDATE
Market Signals
- Container activity remains stable, with total TEUs up 1% YTD and loaded imports up 5%.
- Steel activity strengthened significantly in August, with total steel tonnage up 49% year over year.
- Energy exports remain a major growth driver, with Houston Ship Channel crude oil exports up 40% YTD.
Port Houston continued to demonstrate steady container activity through August 2026, processing 373,756 TEUs during the month, up 1% from August 2025. Year-to-date container volume reached approximately 3.0 million TEUs, also increasing 1% year over year. Loaded imports remained a key source of momentum, increasing 5% year-to-date, while loaded exports declined 1%.
Cargo performance was mixed across major categories, highlighting the diversity of Port Houston's trade base. Steel emerged as a significant Q3 2026 story, with total steel tonnage increasing 49% year over year in August 2026 to 529,084 tons, driven primarily by a 54% increase in steel imports. General cargo increased 22% year to date, while total tonnage at Port Houston's public terminals remained essentially unchanged through August.
At the broader Houston Ship Channel level, trade activity remained strong. Total tonnage increased 15% year to date through July 2026, led by a 21% increase in exports. Crude oil exports increased 40% year-to-date, reinforcing the Channel's importance to Houston's energy and industrial economy.
For industrial real estate, the continued mix of container, energy, steel, and general cargo activity reinforces Southeast Houston's role as a diversified logistics and industrial corridor. Port Houston's ability to serve multiple cargo categories provides demand support beyond container volumes alone.
August 2026 - TEUs
Import 189,151
Export 184,605
Total 373,756
Port Houston continued to demonstrate steady container activity through August 2026.
| CATEGORY | IMPORT | EXPORT |
|---|---|---|
| General | DOWN 13% | DOWN 74% |
| Steel | UP 54% | DOWN 9% |
| Dry Bulk | UP 100% | DOWN 80% |
| Liquid Bulk | UP 13% | DOWN 1% |
| Container | UP 6% | UP 1% |
| TOTAL | UP 32% | DOWN 32.6% |
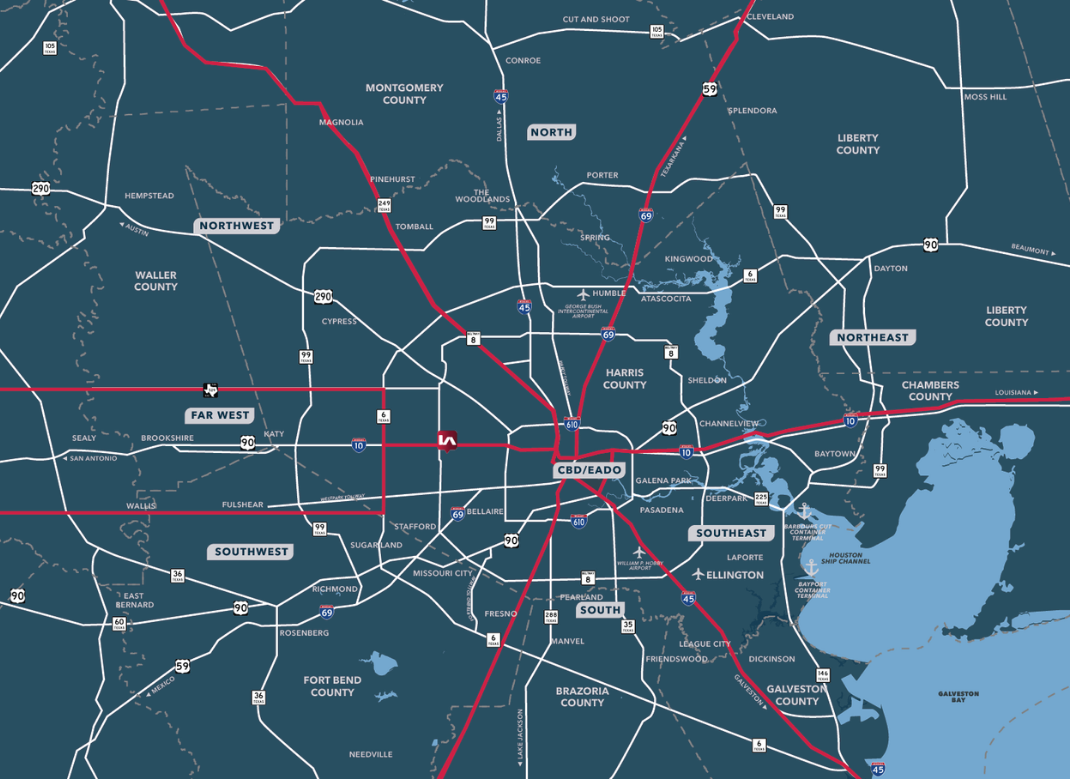
HOUSTON INDUSTRIAL SUBMARKET
RESEARCH TEAM
- MARY DOETTERL | RESEARCH DIRECTOR | [email protected]
- ELIZABETH WANG | SENIOR RESEARCH ANALYST | [email protected]
- NATHAN KRUEGER | RESEARCH ANALYST | [email protected]
- KATIE MARTINEZ | JUNIOR RESEARCH ANALYST | [email protected]
Contact Us
Submit your email to download the Quarterly Industrial Distribution Market Report