
Greater Houston | Office Market Report Q3 2026
EXECUTIVE SUMMARY
Houston’s 3rd quarter office market delivered an uneven result across classes. With virtually no city-wide net absorption and change in average rental rates, the CBD continues to hemorrhage tenants with quarterly negative net absorption of 234,740 square feet while suburban office buildings accounted for 100% of the quarter’s positive net absorption of 195,002 square feet. What’s more, 100% of the broader market YTD net absorption of 328,530 square feet can be traced directly to Class A suburban YTD net absorption of 816,761 square feet. These numbers are driven by workplace utilization, continued metro population growth to the southwest, west and northwest suburbs that drive employers to move closer to their employees, and quality amenitized buildings that help encourage workers to come to work.
The office quarter forthcoming will continue the trend of Class A outperforming Class B with few exceptions. The landscape will be heavily influenced by capital markets such as cost of capital, favorable basis resets from sales, and, capital available for leasing, capex and amenitization will result in additional pressure being applied to higher basis assets and/or ownerships that lack capital. As always, tenant office space demand will drive the broader market performance and it’s reasonable to expect the energy economy, AI, and corporate office sizing to have significant impact as the ups and downs of uncertain international affairs are tempered by Houston’s population growth, diversity of business, and, having nation leading port activity.
BILL INSULL, CCIM | Principal
KEY TAKEAWAYS
ASKING RENTS REMAIN STABLE
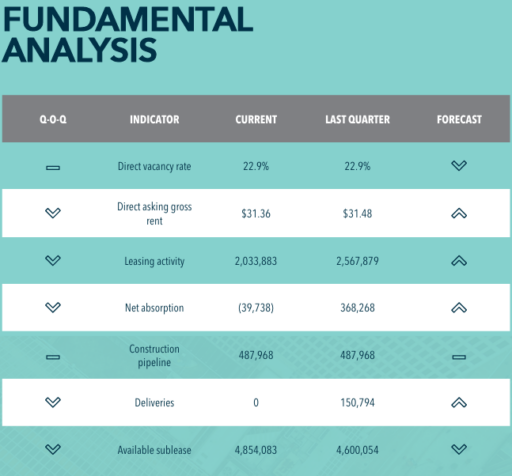
Direct asking gross rents measured $31.36 per square foot in Q3 2026, down just 0.4% quarter over quarter, while rents remained near $31.00 per square foot for the fifth consecutive quarter.
VACANCY REMAINS ELEVATED BUT STABLE
Direct vacancy held at 22.9%, reflecting limited movement in overall occupancy as tenants continue to evaluate space requirements and workplace strategies.
LEASING ACTIVITY MODERATED
Q3 leasing activity totaled approximately 2.0 million square feet, down 20.8% from Q2 2026, but remained within the range recorded during the past five quarters.
OCCUPANCY REMAINS ESSENTIALLY FLAT
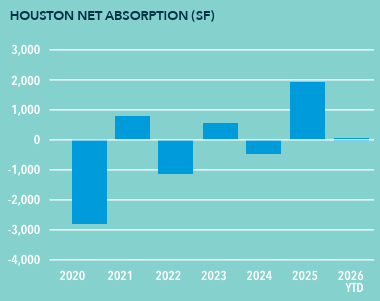
Q3 2026 net absorption totaled negative 39,738 square feet, bringing 2026 YTD net absorption to approximately 50,900 square feet. The limited movement highlights how slowly Houston's office market is working through elevated vacancy.
FLIGHT TO QUALITY CONTINUES TO SHAPE THE MARKET
Class A asking rents remained significantly above Class B at $36.47 per square foot versus $23.32 per square foot, a $13.15-per-square-foot premium. Building quality, location, amenities, and workplace functionality continue to influence tenant decisions.
DEVELOPMENT REMAINS LIMITED
Approximately 488,000 square feet is currently under construction, while 2026 YTD deliveries total approximately 662,000 square feet. Limited new supply should allow existing inventory more time to absorb vacancy.
DIRECT ASKING GROSS RENT VS DIRECT VACANCY RATE
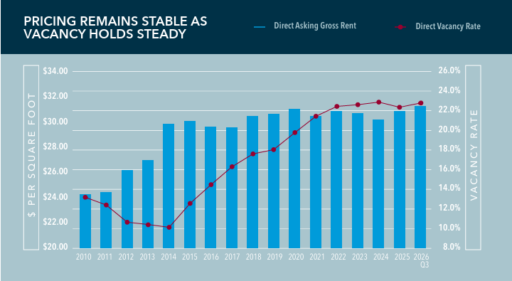
Houston's office market remained stable during Q3 2026, with direct asking gross rents holding near recent highs while direct vacancy remained unchanged. The citywide direct asking gross rent measured $31.36 per square foot, down just 0.4% from $31.48 in Q2 2026, while direct vacancy held steady at 22.9%.
Rental performance has remained remarkably consistent over the past five quarters. Citywide direct asking gross rents have remained near $31.00 per square foot since Q3 2025, demonstrating continued pricing stability despite elevated vacancy and uneven occupancy gains.
Rather than competing primarily through lower asking rents, landlords continue to utilize tenant improvement allowances, concessions, building upgrades, and other incentives to attract tenants.
Q3 2026 net absorption totaled negative 39,738 square feet, reflecting limited movement in overall occupancy during the quarter. While the result represents a moderation from the positive absorption recorded in Q2 2026, the relatively small change is consistent with a market where tenant activity continues but meaningful occupancy gains remain gradual.
Looking ahead, limited new supply should continue to provide support for existing office properties, while performance is expected to remain increasingly differentiated by asset quality and location. Well-located, high-quality buildings should remain best positioned to maintain pricing and capture tenant demand as Houston's office market continues to work through elevated vacancy.
FLIGHT TO QUALITY CONTINUES AS ASKING RENTS HOLD STEADY
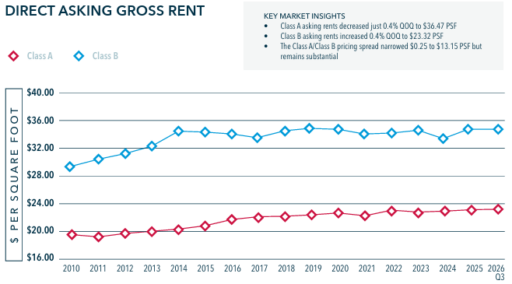
Tenant preference for higher-quality office space continues to influence Houston's leasing market, while asking rents remained remarkably stable during Q3 2026. Class A direct asking gross rents averaged $36.47 per square foot, down just 0.4% from $36.63 in Q2 2026. Class B rents increased 0.4% quarter over quarter to $23.32 per square foot, compared with $23.23 in Q2 2026.
The pricing gap between Class A and Class B space remained substantial at approximately $13.15 per square foot, narrowing slightly from $13.40 in Q2 2026. The continued premium reflects the market's differentiation between premier office properties and older commodity inventory as occupiers remain focused on building quality, location, amenities, operational efficiency, and employee experience.
Despite elevated vacancy, Class A landlords have largely maintained asking rents, competing through tenant improvement allowances, concessions, amenity investments, and building upgrades rather than significant reductions in face rates. Class B properties continue to face greater competitive pressure, particularly where aging improvements, location, or limited amenities make it more difficult to compete with higher-quality alternatives.
Looking ahead, the flight-to-quality trend should continue to shape leasing decisions. With limited new construction, well-located Class A properties offering modern amenities and high-quality space should remain best positioned to capture tenant demand, while older Class B assets may increasingly require capital investment, repositioning, or more aggressive leasing strategies to remain competitive.
NET ABSORPTION VS DIRECT VACANCY RATE
MARKET HIGHLIGHTS
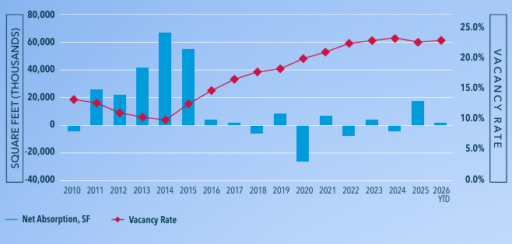
• Q3 net absorption totaled (39,738) square feet, representing essentially flat quarterly occupancy
• YTD net absorption remained slightly positive at 51K square feet
• Direct vacancy held steady at 22.9%, while rolling 12-month net absorption remained positive at 328,530 square feet
Houston's office market recorded relatively stable occupancy during Q3 2026, with net absorption totaling negative 39,738 square feet following positive absorption of 368,268 square feet in Q2 2026. Despite the quarterly moderation, direct vacancy remained unchanged at 22.9%, reflecting limited movement in overall occupancy.
Quarterly absorption has continued to fluctuate as tenants evaluate space requirements, renew existing leases, relocate to higher-quality properties, and adjust footprints. Q3's modest occupancy loss represents approximately 0.02% of Houston's office inventory, underscoring how little the market's overall occupied base changed during the quarter.
The composition of absorption also tells an important story.
Class A recorded negative 105,800 square feet of Q3 2026 absorption, while Class B posted positive 66,062 square feet. While the broader flight-to-quality trend remains important, quarterly absorption can be influenced by the timing of individual move-ins and move-outs and should be evaluated alongside leasing activity and longer-term trends.
Through the first nine months of 2026, Houston recorded approximately 50,900 square feet of positive net absorption, reflecting essentially flat occupancy year to date. On a rolling 12-month basis, net absorption remained positive at approximately 328,500 square feet, providing additional context for a market where occupancy gains remain gradual.
Looking ahead, limited new construction should help prevent significant additional supply pressure, while leasing activity and tenant move-ins will remain critical to generating sustained occupancy improvement.
OCCUPANCY RECOVERY & NET ABSORPTION
MARKET INSIGHTS
Houston workplace utilization remains above Kastle's 10-city average, while approximately 50,900 square feet of positive YTD net absorption reflects essentially stable citywide office occupancy through the first nine months of 2026
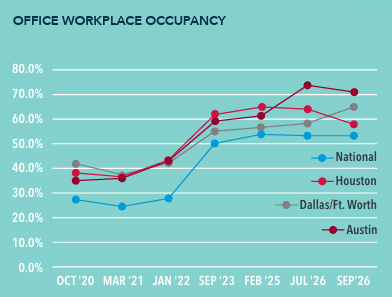
Houston's workplace utilization remained above the broader national benchmark during Q3 2026. According to Kastle Systems' Back to Work Barometer, Houston's average weekly office occupancy reached 57.9% for the week ending September 16, 2026, compared with 56.3% across Kastle's 10-city average. While Austin and Dallas reported higher workplace attendance during the same week, Houston continues to demonstrate relatively strong office utilization compared with several other major U.S. markets.
Through the first nine months of 2026, Houston recorded approximately 50,900 square feet of positive net absorption, effectively representing flat occupancy across the market's approximately 238 million square feet of Class A and Class B office inventory. The limited movement in occupied space illustrates that stronger workplace attendance has not yet translated into significant expansion of leased office footprints.
This distinction remains important. Employees are using office space at relatively healthy levels, while occupiers continue to evaluate space efficiency, hybrid work strategies, lease expirations, and opportunities to relocate into higher-quality buildings. Increased workplace attendance therefore does not necessarily result in immediate growth in leased square footage.
One encouraging indicator remains the continued preference for higher-quality office environments. Kastle's national Class A+ occupancy measure reached 79.0% in the latest weekly reading. While this is a national rather than Houston-specific measure, it supports the broader flight-to-quality trend evident across Houston's office market.
CONSTRUCTION PIPELINE
LIMITED DEVELOPMENT CONTINUES TO DEFINE HOUSTON'S OFFICE MARKET
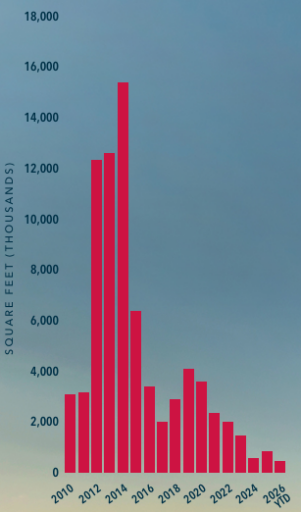
Houston's office construction pipeline remained historically limited during Q3 2026, with approximately 487,968 square feet under construction. While the pipeline increased from Q2 2026, development remains well below pre-pandemic levels as elevated vacancy, higher construction and financing costs, and changing office-use patterns continue to limit speculative development.
No new office buildings delivered during Q3 2026, leaving 2026 year-to-date deliveries at approximately 662,000 square feet. New supply has remained highly selective, with recent deliveries and active projects primarily consisting of single-tenant, owner-occupied, mixed-use, or strategically located developments rather than traditional large-scale speculative office construction.
The current pipeline includes SCI's 210,000-square-foot headquarters and the 127,651-square-foot Autry Park One, both in Midtown and expected to deliver during Q4 2026. Longer-term projects include Southern Land Company's 104,434-square-foot Kirby Office Tower in Greenway Plaza and Majestic Developers' 45,883-square-foot headquarters in Fort Bend County/Sugar Land.
Houston's limited development pipeline remains important given the market's relatively flat occupancy environment since the pandemic. With direct vacancy at 22.9% and only approximately 51,000 square feet of positive YTD net absorption, restrained construction reduces the risk of significant new supply entering the market before existing vacancy has time to work through the system.
QUARTER TREND ANALYSIS
| 2026 Q3 | 2026 Q2 | 2026 Q1 | 2025 Q4 | 2025 Q3 | |
|---|---|---|---|---|---|
| Direct vacancy rate | 22.9% | 22.9% | 23.0% | 22.8% | 22.5% |
| Direct asking gross rent | $31.36 | $31.48 | $31.07 | $31.08 | $30.96 |
| Leasing activity | 2,033,883 | 2,567,879 | 2,860,602 | 2,215,369 | 2,596,679 |
| Sales activity (SF) manual | 4,664,441 | 7,674,510 | 2,557,003 | 2,740,735 | 10,500,886 |
| Net absorption | (39,738) | 368,268 | (277,613) | (180,316) | 377,456 |
| Construction pipeline | 487,968 | 487,968 | 488,445 | 820,234 | 869,351 |
| Deliveries | 0 | 150,794 | 511,580 | 80,000 | 49,117 |
| Available sublease | 4,854,083 | 4,600,054 | 4,899,748 | 5,611,529 | 5,468,998 |
STABILITY DEFINES HOUSTON OFFICE MARKET
Houston's office market remained relatively stable during Q3 2026, with direct vacancy holding at 22.9% and direct asking gross rent measuring $31.36 per square foot, down just 0.4% quarter over quarter. Asking rents have remained near $31.00 per square foot for five consecutive quarters, demonstrating continued pricing stability despite elevated vacancy and limited occupancy growth.
Quarterly leasing activity totaled approximately 2.0 million square feet, down 20.8% from the revised 2.57 million square feet recorded in Q2 2026. While leasing volume moderated, activity remained within the range recorded over the past five quarters. Q3 2026 net absorption totaled negative 39,738 square feet, following revised positive absorption of 368,268 square feet in Q2 2026.
Available sublease space increased 5.5% quarter over quarter to approximately 4.85 million square feet but remained below the 5.61 million square feet recorded in Q4 2025. The movement in sublease availability continues to reflect changing tenant requirements as occupiers evaluate space efficiency, lease expirations, and workplace strategies.
Overall, Q3 2026 reflects a Houston office market that continues to work through a prolonged post-COVID stabilization period rather than a rapid recovery. Stable asking rents, relatively unchanged vacancy, moderated leasing activity, and limited net absorption point to a market increasingly defined by tenant selectivity, asset quality, and location.
| Tenant | Building Name/Address | Square Feet | Submarket |
|---|---|---|---|
| Commencements | |||
| Westlake Corporation | 5444 Westheimer | 140,600 | West Loop/Galleria |
| Magnolia Oil Company | 990 Town & Country Way | 60,000 | Katy Freeway East |
| Quanta Infrastructure Solutions | 1000 Energy Drive | 30,983 | Woodlands |
| Leasing Activity | |||
| Harris County Flood Control District | 4425 Westway Park Boulevard | 86,743 | West Belt/Highway 290 |
| Target Hospitality | 1790 Hughes Landing Boulevard | 52,234 | Woodlands |
| Michel’s Corporation (Sublease) | 12140 Wickchester | 50,380 | Katy Freeway West |
| Available Sublease | |||
| NOV | NOV Headquarters | 410,465 | Southwest/Beltway 8 |
| JP Morgan Chase | The Jones on Main | 122,365 | Central Business District |
| McDermott International | Energy Center V | 99,501 | Katy Freeway West |
| Buyer | Seller | Building Name/Address | Square Feet | Submarket |
| Sale Transactions | |||
| The Williams Companies | Invesco/MetLife | Williams Tower | 1,452,818 | West Loop/Galleria |
| The Wideman Company | Brookfield | 1201 Louisiana | 834,000 | Central Business District |
| Fuller Realty | Granite Properties, Inc. | Eldridge Place Campus | 828,784 | Katy Freeway West |
| Developer / Owner | Building Name/Address | Square Feet | Submarket |
| Deliveries | |||
| No Deliveries Q3 2026 | |||
| Construction | |||
| Service Corporation International | 1945 Allen Parkway | 210,000 | Allen Parkway/Midtown |
| Hanover Company | Autry Park Drive | 127,651 | Allen Parkway/Midtown |
| Southern Land Company | 2811 Kirby Drive | 104,434 | Greenway Plaza |
SALES OVERVIEW
SELECTIVE CAPITAL ACTIVITY CONTINUES ACROSS HOUSTON’S OFFICE MARKET
Houston's office investment market remained active during Q3 2026, although capital continued to be selective and transaction activity varied across submarkets. Buyers remained focused on well-located office properties where pricing, leasing potential, redevelopment opportunities, or owner-user considerations can support long-term value.
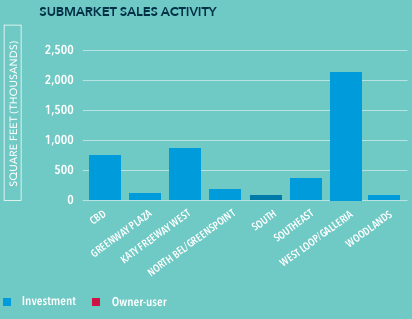
Sales activity remained concentrated across several Houston submarkets, with the Submarket Sales Activity chart illustrating where capital was most active during the quarter. The diversity of transactions reinforces that office investment is not being driven by a single submarket or property strategy, but rather by individual asset characteristics and basis.
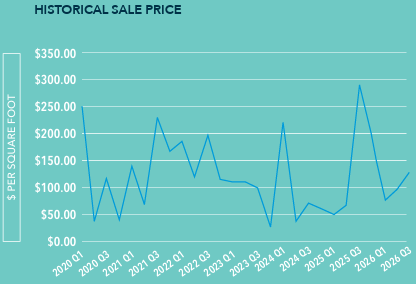
The Historical Sale Price trend continues to demonstrate the significant repricing that has occurred across Houston's office market since the pandemic. Current pricing remains well below prior-cycle levels, creating opportunities for investors willing to evaluate properties on an asset-by-asset basis. At the same time, elevated vacancy and uncertainty surrounding future office demand continue to require careful underwriting.
Investment activity remains highly differentiated between well-located, higher-quality assets and older commodity properties. Buyers pursuing value-add opportunities are increasingly evaluating opportunities for repositioning, leasing improvements, and alternative uses, while owner-users continue to represent another source of demand for select office properties.
Overall, Houston's office investment market remains active but highly selective, with transaction volume and pricing increasingly determined by asset quality, location, occupancy, basis, and the potential to create additional value.
NOTABLE SALES
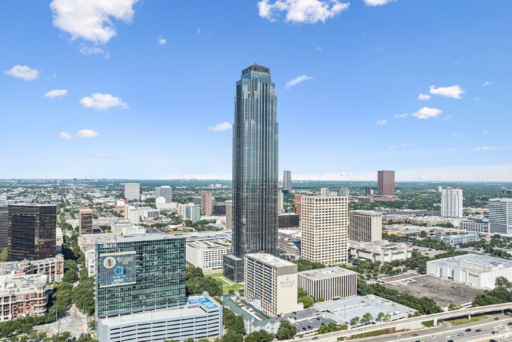
WILLIAMS TOWER
2800 POST OAK BOULEVARD HOUSTON, TX 77056
UPTOWN HOUSTON | 1,452,818 SF | BUILT 1983
SELLER: INVESCO, LTD.
BUYER: THE WILLIAMS COMPANIES, INC.
BUYER TYPE: INVESTMENT
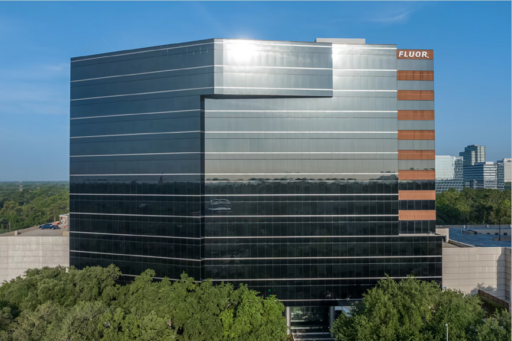
ELDRIDGE PLACE CAMPUS
737-777 N ELDRIDGE PKWY | HOUSTON, TX 77079
KATY FREEWAY WEST | 828,784 SF | BUILT 1986
SELLER: GRANITE PROPERTIES, INC.
BUYER: FULLER REALTY INTERESTS
BUYER TYPE: INVESTMENT
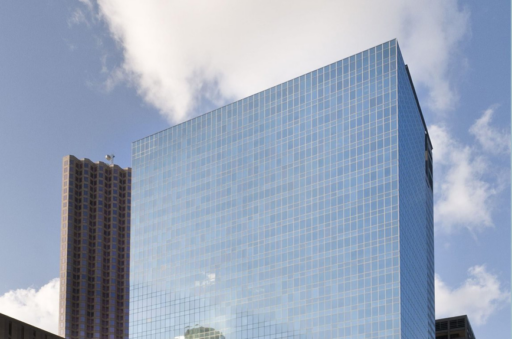
1201 LOUISIANA
1201 LOUISIANA STREET | HOUSTON, TX 77002
CENTRAL BUSINESS DISTRICT | 834,000 SF | BUILT 1971
SELLER: BGRE
BUYER: THE WIDEMAN COMPANY
BUYER TYPE: INVESTMENT
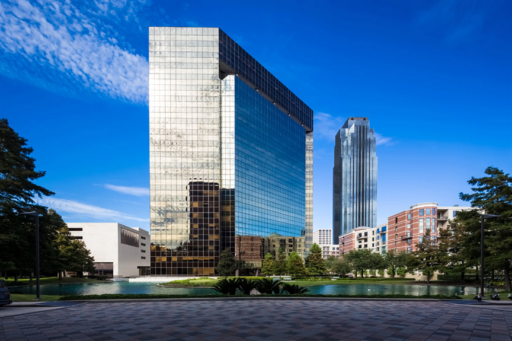
LAKES ON POST OAK
3000 POST OAK BOULEVARD | HOUSTON, TX 77056
UPTWON HOUSTON | 457,296 SF | BUILT 1979
SELLER: LNR PARTNERS
BUYER: AFFINIUS CAPITAL LLC
BUYER TYPE: INVESTMENT
| Submarket / Class | Inventory (SF) | Direct Vacancy Rate | Sublease Vacancy Rate | Total Vacancy Rate | Previous Quarter Direct Vacancy Rate | Direct Asking Gross Rent | Current Quarter Leasing Activity (SF) | YTD Leasing Activity (SF) | Current Quarter Net Absorption (SF) | YTD Net Absorption (SF) | Construction Pipeline (SF) | YTD Deliveries (SF) |
|---|---|---|---|---|---|---|---|---|---|---|---|---|
| Total Houston Market | ||||||||||||
| Class A | 139,546,016 | 23.9% | 1.3% | 25.2% | 23.8% | $36.47 | 1,438,973 | 3,169,708 | (105,800) | 788,047 | 487,968 | 662,374 |
| Class B | 98,399,771 | 21.4% | 1.0% | 22.4% | 21.5% | $23.32 | 594,910 | 1,432,054 | 66,062 | (459,517) | 0 | 0 |
| Total | 237,945,787 | 22.9% | 1.2% | 24.0% | 22.9% | $31.36 | 2,033,883 | 4,601,762 | (39,738) | 328,530 | 487,968 | 662,374 |
| Central Business District | ||||||||||||
| Class A | 39,304,566 | 25.0% | 0.8% | 25.9% | 24.5% | $43.89 | 177,348 | 488,682 | (205,301) | (28,714) | 0 | 0 |
| Class B | 11,289,811 | 27.7% | 0.3% | 27.9% | 27.7% | $21.40 | 0 | 460 | (29,439) | (28,032) | 0 | 0 |
| Total | 50,594,377 | 25.6% | 0.7% | 26.3% | 25.2% | $39.44 | 177,348 | 489,142 | (234,740) | (56,746) | 0 | 0 |
| Suburban | ||||||||||||
| Class A | 100,241,450 | 23.4% | 1.5% | 24.9% | 23.5% | $33.20 | 1,261,625 | 2,681,026 | 99,501 | 816,761 | 487,968 | 662,374 |
| Class B | 87,109,960 | 20.6% | 1.1% | 21.7% | 20.7% | $23.58 | 594,910 | 1,431,594 | 95,501 | (431,485) | 0 | 0 |
| Total | 187,351,410 | 22.1% | 1.3% | 23.4% | 22.2% | $28.90 | 1,856,535 | 4,112,620 | 195,002 | 385,276 | 487,968 | 662,374 |
| Submarket / Class | Inventory (SF) | Direct Vacancy Rate | Sublease Vacancy Rate | Total Vacancy Rate | Previous Quarter Direct Vacancy Rate | Direct Asking Gross Rent | Current Quarter Leasing Activity (SF) | YTD Leasing Activity (SF) | Current Quarter Net Absorption (SF) | YTD Net Absorption (SF) | Construction Pipeline (SF) | YTD Deliveries (SF) |
|---|---|---|---|---|---|---|---|---|---|---|---|---|
| FM 1960/Highway 249 | ||||||||||||
| Class A | 2,573,667 | 56.9% | 0.0% | 56.9% | 56.1% | $30.10 | 93,692 | 159,536 | 66,444 | 115,596 | 0 | 0 |
| Class B | 4,012,089 | 27.3% | 0.3% | 27.6% | 27.6% | $29.46 | 42,271 | 61,174 | (32,380) | (34,414) | 0 | 0 |
| Total | 6,585,756 | 38.8% | 0.2% | 39.0% | 38.8% | $29.78 | 135,963 | 220,710 | 34,064 | 81,182 | 0 | 0 |
| Greenway Plaza | ||||||||||||
| Class A | 7,935,545 | 27.2% | 1.2% | 28.4% | 27.2% | $36.14 | 55,239 | 188,934 | (5,919) | 20,136 | 104,434 | 150,794 |
| Class B | 3,066,442 | 24.6% | 0.2% | 24.8% | 22.7% | $29.19 | 23,491 | 61,961 | (57,391) | (129,644) | 0 | 0 |
| Total | 11,001,987 | 26.5% | 0.9% | 27.4% | 26.0% | $34.62 | 78,730 | 250,895 | (63,310) | (109,508) | 104,434 | 150,794 |
| Gulf Freeway/Pasadena | ||||||||||||
| Class A | 522,746 | 7.3% | 0.0% | 7.3% | 7.3% | $35.00 | 0 | 0 | 0 | 0 | 0 | 95,000 |
| Class B | 2,448,030 | 17.6% | 0.6% | 18.2% | 17.8% | $23.95 | 28,931 | 102,945 | 5,814 | (3,205) | 0 | 0 |
| Total | 2,970,776 | 15.8% | 0.5% | 16.3% | 16.0% | $25.00 | 28,931 | 102,945 | 5,814 | (3,205) | 0 | 95,000 |
| I-10 East | ||||||||||||
| Class B | 510,209 | 11.6% | 0.0% | 11.6% | 10.2% | $19.60 | 7,580 | 8,053 | (7,051) | 7,120 | 0 | 0 |
| Total | 510,209 | 11.6% | 0.0% | 11.6% | 10.2% | $19.60 | 7,580 | 8,053 | (7,051) | 7,120 | 0 | 0 |
| Katy Freeway East | ||||||||||||
| Class A | 6,470,140 | 9.2% | 2.1% | 11.3% | 10.3% | $57.79 | 110,321 | 246,127 | 57,656 | 498,501 | 0 | 336,580 |
| Class B | 2,251,727 | 18.6% | 0.0% | 18.6% | 17.5% | $25.24 | 29,963 | 62,351 | (24,705) | (40,070) | 0 | 0 |
| Total | 8,721,867 | 11.6% | 1.6% | 13.2% | 12.1% | $37.93 | 140,284 | 308,478 | 32,951 | 458,431 | 0 | 336,580 |
| Katy Freeway West | ||||||||||||
| Class A | 16,077,809 | 17.6% | 2.7% | 20.4% | 17.6% | $31.81 | 208,170 | 326,092 | (1,948) | 386 | 0 | 0 |
| Class B | 9,488,751 | 22.9% | 0.5% | 23.3% | 22.7% | $24.32 | 88,398 | 217,765 | (11,435) | (301,172) | 0 | 0 |
| Total | 25,566,560 | 19.6% | 1.9% | 21.5% | 19.5% | $27.45 | 296,568 | 543,857 | (13,383) | (300,786) | 0 | 0 |
| Katy/Grand Parkway West | ||||||||||||
| Class A | 1,644,457 | 19.6% | 0.0% | 19.6% | 20.5% | $34.04 | 20,750 | 44,477 | 13,868 | 16,990 | 0 | 0 |
| Class B | 778,693 | 8.7% | 0.0% | 8.7% | 8.8% | $38.19 | 4,131 | 6,019 | 345 | 28 | 0 | 0 |
| Total | 2,423,150 | 16.1% | 0.0% | 16.1% | 16.7% | $35.38 | 24,881 | 50,496 | 14,213 | 17,018 | 0 | 0 |
| Kingwood/Humble | ||||||||||||
| Class A | 270,000 | 0.0% | 0.0% | 0.0% | 0.0% | N/A | 0 | 0 | 0 | 0 | 0 | 0 |
| Class B | 1,172,156 | 4.9% | 0.6% | 5.5% | 4.7% | $21.13 | 2,794 | 3,814 | (2,831) | 2,436 | 0 | 0 |
| Total | 1,442,156 | 4.0% | 0.5% | 4.4% | 3.8% | $21.13 | 2,794 | 3,814 | (2,831) | 2,436 | 0 | 0 |
| NASA/Clear Lake | ||||||||||||
| Class A | 1,874,315 | 13.1% | 1.2% | 14.3% | 8.5% | $29.77 | 30,848 | 30,848 | (67,369) | (63,364) | 0 | 80,000 |
| Class B | 3,371,278 | 19.5% | 0.0% | 19.5% | 21.7% | $23.31 | 5,092 | 86,310 | 74,664 | 96,893 | 0 | 0 |
| Total | 5,245,593 | 17.2% | 0.4% | 17.6% | 17.0% | $24.60 | 35,940 | 117,158 | 7,295 | 33,529 | 0 | 80,000 |
| North Belt/Greenspoint | ||||||||||||
| Class A | 4,487,165 | 54.3% | 0.4% | 54.7% | 53.8% | $19.03 | 23,640 | 45,621 | (24,706) | (26,087) | 0 | 0 |
| Class B | 6,845,517 | 33.5% | 0.1% | 33.6% | 34.1% | $15.17 | 22,649 | 58,265 | 37,498 | 27,272 | 0 | 0 |
| Total | 11,332,682 | 41.8% | 0.2% | 42.0% | 41.9% | $17.33 | 46,289 | 103,886 | 12,792 | 1,185 | 0 | 0 |
| North Loop West | ||||||||||||
| Class A | 1,474,487 | 21.0% | 0.0% | 21.0% | 23.5% | $26.39 | 9,381 | 96,488 | 37,521 | 30,672 | 0 | 0 |
| Class B | 2,166,921 | 15.6% | 0.3% | 15.9% | 16.1% | $20.80 | 40,546 | 73,342 | 10,563 | 59,759 | 0 | 0 |
| Total | 3,641,408 | 17.8% | 0.2% | 17.9% | 19.1% | $23.44 | 49,927 | 169,830 | 48,084 | 90,431 | 0 | 0 |
| Northeast | ||||||||||||
| Class A | 643,952 | 0.4% | 0.0% | 0.4% | 0.4% | N/A | 0 | 0 | 0 | 0 | 0 | 0 |
| Class B | 715,899 | 1.2% | 0.0% | 1.2% | 1.6% | $27.00 | 2,200 | 8,948 | 2,561 | 9,612 | 0 | 0 |
| Total | 1,359,851 | 0.8% | 0.0% | 0.8% | 1.0% | $27.00 | 2,200 | 8,948 | 2,561 | 9,612 | 0 | 0 |
| Northwest | ||||||||||||
| Class A | 1,003,410 | 23.9% | 2.0% | 26.0% | 20.4% | $19.68 | 10,572 | 27,795 | (47,710) | (16,924) | 0 | 0 |
| Class B | 3,799,639 | 6.5% | 0.3% | 6.9% | 7.2% | $16.94 | 23,390 | 57,981 | 26,335 | 18,763 | 0 | 0 |
| Total | 4,803,049 | 10.2% | 0.7% | 10.8% | 10.0% | $17.98 | 33,962 | 85,776 | (21,375) | 1,839 | 0 | 0 |
| Richmond/Fountain View | ||||||||||||
| Class B | 731,754 | 16.0% | 0.0% | 16.0% | 16.0% | $17.45 | 0 | 0 | 0 | (9,688) | 0 | 0 |
| Total | 731,754 | 16.0% | 0.0% | 16.0% | 16.0% | $17.45 | 0 | 0 | 0 | (9,688) | 0 | 0 |
| San Felipe/Voss | ||||||||||||
| Class A | 2,361,796 | 27.2% | 5.2% | 32.4% | 27.9% | $32.03 | 102,040 | 181,831 | 4,798 | (9,855) | 0 | 0 |
| Class B | 2,799,376 | 22.2% | 0.4% | 22.6% | 23.3% | $23.28 | 24,725 | 24,725 | 29,568 | 53,546 | 0 | 0 |
| Total | 5,161,172 | 24.5% | 2.6% | 27.1% | 25.4% | $27.17 | 126,765 | 206,556 | 34,366 | 43,691 | 0 | 0 |
| South | ||||||||||||
| Class A | 587,618 | 6.1% | 0.0% | 6.1% | 6.4% | $27.08 | 0 | 0 | 1,715 | 1,715 | 0 | 0 |
| Class B | 540,805 | 18.4% | 0.0% | 18.4% | 6.4% | $29.95 | 522 | 522 | (66,012) | (65,406) | 0 | 0 |
| Total | 1,128,423 | 12.1% | 0.0% | 12.1% | 6.4% | $28.60 | 522 | 522 | (64,297) | (63,691) | 0 | 0 |
| South Main/Medical Center | ||||||||||||
| Class A | 250,000 | 0.0% | 0.0% | 0.0% | 0.0% | N/A | 0 | 0 | 0 | 0 | 0 | 0 |
| Class B | 1,362,745 | 10.3% | 0.4% | 10.7% | 10.2% | $18.29 | 15,045 | 15,479 | (1,223) | (15,036) | 0 | 0 |
| Total | 1,612,745 | 8.7% | 0.4% | 9.1% | 8.6% | $23.80 | 15,045 | 15,479 | (1,223) | (15,036) | 0 | 0 |
| Southeast | ||||||||||||
| Class B | 228,543 | 0.0% | 0.0% | 0.0% | 0.0% | N/A | 0 | 0 | 0 | 0 | 0 | 0 |
| Total | 228,543 | 0.0% | 0.0% | 0.0% | 0.0% | N/A | 0 | 0 | 0 | 0 | 0 | 0 |
| Southwest/Beltway 8 | ||||||||||||
| Class A | 1,070,041 | 35.0% | 0.1% | 35.1% | 34.5% | $17.75 | 4,507 | 8,509 | (5,062) | (5,819) | 0 | 0 |
| Class B | 7,057,481 | 19.9% | 5.1% | 25.0% | 19.5% | $21.04 | 9,277 | 31,240 | (30,902) | (48,700) | 0 | 0 |
| Total | 8,127,522 | 21.9% | 4.5% | 26.3% | 21.5% | $19.93 | 13,784 | 39,749 | (35,964) | (54,519) | 0 | 0 |
| Southwest Far | ||||||||||||
| Class A | 80,536 | 32.5% | 3.5% | 35.9% | 32.5% | $37.53 | 0 | 0 | (2,800) | 1,736 | 0 | 0 |
| Class B | 512,457 | 0.0% | 11.2% | 11.2% | 0.0% | N/A | 0 | 0 | 0 | 0 | 0 | 0 |
| Total | 592,993 | 4.4% | 10.2% | 14.6% | 4.4% | $37.53 | 0 | 0 | (2,800) | 1,736 | 0 | 0 |
| West Belt/Highway 290 | ||||||||||||
| Class A | 3,471,210 | 26.1% | 3.9% | 29.9% | 24.9% | $31.77 | 137,152 | 188,257 | (45,167) | (18,458) | 0 | 0 |
| Class B | 2,047,122 | 25.9% | 0.0% | 25.9% | 30.2% | $24.26 | 8,520 | 11,816 | 87,083 | 89,530 | 0 | 0 |
| Total | 5,518,332 | 26.0% | 2.4% | 28.5% | 26.9% | $28.78 | 145,672 | 200,073 | 41,916 | 71,072 | 0 | 0 |
| West Loop/Galleria | ||||||||||||
| Class A | 17,606,203 | 30.9% | 0.8% | 31.7% | 31.6% | $39.69 | 250,078 | 496,005 | 122,276 | 194,921 | 0 | 0 |
| Class B | 6,545,505 | 35.3% | 0.3% | 35.7% | 34.1% | $28.30 | 68,182 | 148,650 | (84,807) | (126,724) | 0 | 0 |
| Total | 24,151,708 | 32.1% | 0.7% | 32.8% | 32.2% | $36.18 | 318,260 | 644,655 | 37,469 | 68,197 | 0 | 0 |
| Westchase | ||||||||||||
| Class A | 9,471,821 | 27.5% | 0.6% | 28.1% | 27.1% | $30.04 | 77,375 | 180,075 | (45,403) | (20,910) | 0 | 0 |
| Class B | 7,856,353 | 23.1% | 3.7% | 26.8% | 23.4% | $20.00 | 50,899 | 88,316 | 19,948 | (69,917) | 0 | 0 |
| Total | 17,328,174 | 25.5% | 2.0% | 27.5% | 25.4% | $26.10 | 128,274 | 268,391 | (25,455) | (90,827) | 0 | 0 |
| Woodlands | ||||||||||||
| Class A | 13,432,055 | 7.3% | 1.5% | 8.8% | 7.6% | $42.92 | 88,682 | 272,196 | 39,429 | 103,614 | 0 | 0 |
| Class B | 4,043,714 | 15.0% | 1.6% | 16.6% | 15.5% | $29.73 | 27,045 | 104,470 | 56,312 | 435 | 0 | 0 |
| Total | 17,475,769 | 9.1% | 1.5% | 10.6% | 9.4% | $39.00 | 115,727 | 376,666 | 95,741 | 104,049 | 0 | 0 |
MARKET OUTLOOK
STABILITY, SELECTIVITY & LIMITED NEW SUPPLY
Houston's office market is expected to remain relatively stable through the remainder of 2026, supported by resilient asking rents, limited new development, and steady workplace utilization. Direct vacancy held at 22.9% during Q3, while direct asking gross rent remained near recent highs at $31.36 per square foot, reinforcing the market's continued pricing stability despite limited occupancy growth.
Occupancy remains the market's primary challenge. Houston recorded approximately 51,000 square feet of positive net absorption through the first nine months of 2026, effectively flat across the market's approximately 238 million square feet of Class A and Class B inventory. Leasing activity remains active, but tenant decisions continue to be influenced by space efficiency, hybrid work strategies, lease expirations, and opportunities to upgrade into higher-quality buildings.
Limited new construction should remain one of Houston's strongest long-term fundamentals.
Approximately 488,000 square feet is currently under construction, while 2026 YTD deliveries total approximately 662,000 square feet. With speculative development remaining limited, the market has time to work through elevated existing vacancy without significant new supply pressure.
Flight to quality should continue to shape leasing performance, with well-located Class A properties benefiting from tenant preference for modern amenities, workplace experience, and operational efficiency. Older commodity buildings will likely face continued pressure to compete through capital improvements, repositioning, concessions, or alternative strategies.
Overall, Houston's office market remains in a prolonged post-COVID stabilization period rather than a rapid recovery. Stable asking rents, disciplined development, steady workplace utilization, and selective tenant and investor activity should continue defining market conditions heading into 2027.
KEY OPPORTUNITIES & RISKS
Opportunities
+ Limited new construction provides time for existing vacancy to be absorbed.
+ Flight to quality continues supporting well-located, high-quality office assets.
+ Stable asking rents and workplace utilization provide a foundation for longer-term market balance.
Risks
+ Elevated vacancy remains the market's most significant challenge.
+ Limited YTD absorption indicates that meaningful occupancy improvement remains slow.
+ Older commodity properties face increasing pressure from tenant selectivity and capital requirements.
ECONOMIC FUNDAMENTALS REMAIN SUPPORTIVE
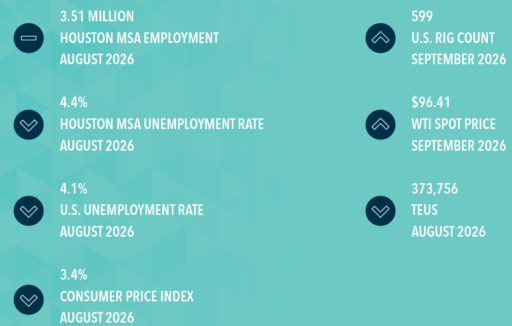
Houston's economy remained resilient through Q3 2026, supported by stable employment, moderating inflation, continued energy activity, and steady trade volumes. Total Houston MSA employment measured approximately 3.51 million jobs in August, while the local unemployment rate improved to 4.4%, compared with 4.6% in May.
Inflation also moderated during the quarter, with the Consumer Price Index increasing 3.4% year over year in August, down from 4.2% in May. Easing inflationary pressure, combined with relatively stable labor market conditions, provides a more supportive operating environment for businesses across the region.
Houston's energy sector remained an important economic driver. The U.S. rig count reached 599 in September, while WTI crude oil measured $96.41 per barrel, supporting continued energy-related business activity and investment. Port Houston also maintained steady trade activity, processing 373,756 TEUs in August.
For Houston's office market, stable employment and continued activity across professional services, energy, healthcare, and corporate operations provide an important foundation for tenant demand. However, employment growth alone is unlikely to materially reduce elevated office vacancy without corresponding expansion in occupied space.

PROFESSIONAL SERVICES CONTINUE TO SUPPORT DEMAND
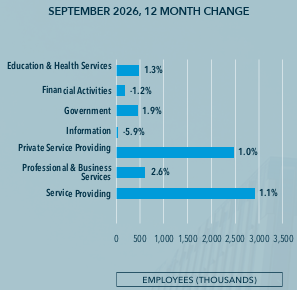
Houston's office-using employment remained positive through September 2026, although growth varied considerably across major sectors. Professional and Business Services employment increased 2.6% year over year to approximately 581,300 jobs, while Education and Health Services increased 1.3% to approximately 476,400 jobs. These sectors remain important components of Houston's office-using employment base and continue to provide support for office demand.
Employment growth was less consistent across other office-oriented sectors. Government employment increased 1.9% to approximately 447,200 jobs, while Financial Activities declined 1.2% to approximately 176,700 jobs. Information employment experienced the largest decline, falling 5.9% to approximately 27,100 jobs. The mixed performance reflects an office economy where growth remains concentrated in select industries.
Overall, Houston's office employment base continues to expand, but at a more moderate and uneven pace following the strong post-pandemic rebound. Continued gains in professional services, healthcare, and government provide support for office demand, while weakness in information and financial activities may limit broader employment-driven absorption.
OFFICE EMPLOYMENT GROWTH NORMALIZES
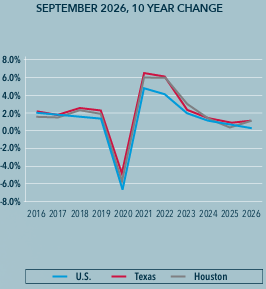
Houston's office-using employment has transitioned to a more sustainable pace following the strong post-pandemic rebound. After the employment contraction experienced in 2020, Houston recorded strong gains from 2021 through 2023 before growth moderated in 2024, 2025, and 2026.
Houston has generally followed the longer-term employment trends of Texas and the U.S., supported by professional services, healthcare, engineering, energy-related corporate operations, and other office-using industries. The current 1.1% growth in service-providing employment reflects continued expansion across the broader employment base, although individual industries are performing at different rates.
Looking ahead, continued job creation should provide underlying support for Houston's office market. However, employment growth alone is unlikely to materially reduce elevated vacancy. Additional job growth will need to translate into occupied office space before Houston experiences meaningful improvement in overall occupancy.
SUBMARKET MAP
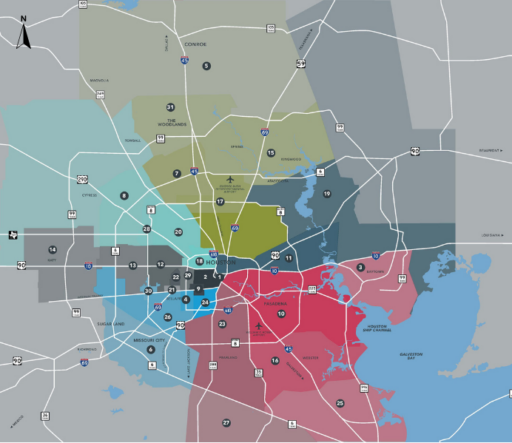
1. CENTRAL BUSINESS DISTRICT
2. ALLEN PARKWAY
3. BAYTOWN
4. BELLAIRE
5. CONROE / MONTGOMERY COUNTY
6. FORT BEND COUNTY / SUGAR LAND
7. FM 1960 / BELTWAY 8
8. FM 1960 / HWY 249
9. GREENWAY PLAZA
10. GULF FREEWAY / PASADENA
11. I-10 EAST
12. KATY FREEWAY EAST
13. KATY FREEWAY WEST
14. KATY / GRAND PARKWAY WEST
15. KINGWOOD / HUMBLE
16. NASA / CLEAR LAKE
17. NORTH BELT / GREENSPOINT
18. NORTH LOOP WEST
19. NORTHEAST
20. NORTHWEST
21. RICHMOND / FOUNTAINVIEW
22. SAN FELIPE / VOSS
23. SOUTH
24. SOUTH MAIN / MEDICAL CENTER
25. SOUTHEAST
26. SOUTHWEST / BELTWAY 8
27. SOUTHWEST FAR
28. WEST BELT / HIGHWAY 290
29. WEST LOOP / GALLERIA
30. WESTCHASE
31. WOODLANDS
OFFICE ADVISORS
CHRIS LEWIS, SIOR
MANAGING PARTNER
LANDLORD REPRESENTATION
BILL INSULL, CCIM
PRINCIPAL
DREW LEWIS
PRINCIPAL
BLAKE R. VIRGILIO, SIOR, CCIM
PRINCIPAL
WADE BOWLIN
EXECUTIVE VICE PRESIDENT
COURTNEY BUCKOUT
DIRECTOR
BLAINE SINCLAIR
DIRECTOR
MAX WELCH
ASSOCIATE
RESEARCH TEAM
- MARY DOETTERL | RESEARCH DIRECTOR | [email protected]
- NATHAN KRUEGER
- KATIE MARTINEZ
- ELIZABETH WANG