Houston Retail | Market Report 2026 Q3
Executive Summary
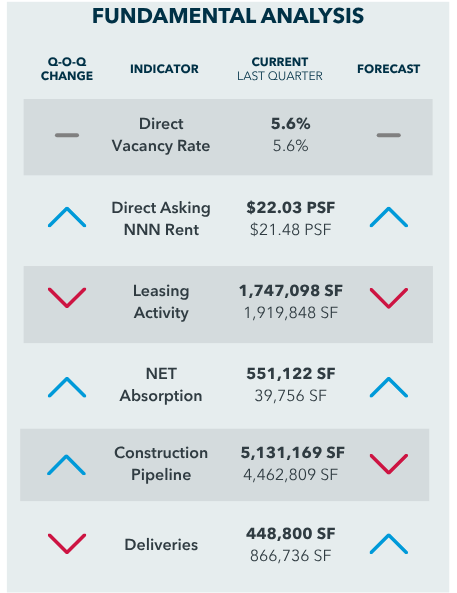
Houston's retail market maintained healthy fundamentals during Q3 2026, supported by stable occupancy, continued rental growth, and positive tenant demand. Direct vacancy remained at 5.6% for the second consecutive quarter, while the average direct asking NNN rent increased to a record $22.03 per square foot, approximately 8.1% above Q3 2025.
Retail demand strengthened during Q3 2026, with net absorption reaching 551,122 square feet, a significant improvement from 39,756 square feet in the previous quarter. Leasing activity totaled approximately 1.75 million square feet, bringing year-to-date leasing activity to nearly 5.9 million square feet. Through the first nine months of 2026, Houston recorded more than 1.1 million square feet of positive net absorption.
Development activity emerged as one of the quarter's most notable trends. Houston's construction pipeline expanded to approximately 5.1 million square feet, the highest level since 2019, while quarterly deliveries moderated to approximately 449,000 square feet. New construction remains concentrated in expanding suburban growth corridors, where population gains, residential development, and household formation continue to create opportunities for additional retail space.
Market performance continues to differ by submarket and retail format. Power Centers maintained particularly strong fundamentals, with direct vacancy measuring just 2.7% and approximately 317,000 square feet of positive year-to-date net absorption. Meanwhile, several established retail destinations and rapidly growing suburban submarkets continued to command asking rents above the citywide average. Retail investment pricing also improved during the quarter, reaching an average of $129.75 per square foot.
Houston enters Q4 2026 with a growing consumer base, expanding suburban development, and generally healthy retail fundamentals. As development activity increases, the balance between new supply and tenant demand will become increasingly important. Well-positioned retail properties in high-growth corridors should remain attractive to tenants, while market performance will continue to reflect differences in location, retail format, and surrounding population growth.
- Mary Doetterl, Research Director


KEY TAKEAWAYS
-
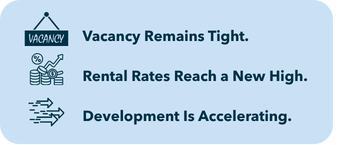
RENTAL RATES REACH NEW HIGH
Direct asking NNN rents increased to $22.03 per square foot, up approximately 8.1% year over year.
-
VACANCY REMAINS TIGHT
Direct vacancy held at 5.6% for the second consecutive quarter, reflecting stable occupancy across Greater Houston.
-
DEMAND REBOUNDS
Quarterly net absorption rebounded to 551,122 square feet, up from 39,756 square feet in Q2 2026.
-
DEVELOPMENT ACCELERATES
Retail construction reached 5.1 million square feet, marking the largest development pipeline since 2019.
-
SUBURBAN GROWTH DRIVES RETAIL DEMAND
Population growth and residential expansion are driving retail demand, rental rates, and new development across Greater Houston's suburban corridors.

DIRECT ASKING NNN RENT AND DIRECT VACANCY RATE
RETAIL RENTS REACH NEW HIGH AS VACANCY REMAINS TIGHT
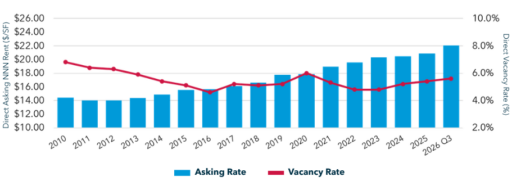
Retail asking rents reached a record $22.03 NNN per square foot in Q3 2026, increasing 5.6% from $20.86 at year-end 2025. The continued rise reflects demand for well-positioned retail space throughout Greater Houston, particularly in established shopping destinations and expanding suburban corridors.
Despite higher asking rents, direct vacancy remained relatively tight at 5.6%, increasing just 20 basis points from 5.4% at year-end 2025. Vacancy has remained within a relatively narrow range for much of the past decade, reflecting steady tenant demand and generally disciplined development activity.
The longer-term trend reinforces the market's pricing strength. Since 2010, direct asking NNN rents have increased approximately 53%, from $14.43 per square foot to $22.03 per square foot. During the same period, vacancy declined from 6.8% to 5.6%, demonstrating sustained rental growth alongside relatively stable occupancy.
Looking toward year-end, population growth, residential development, and limited availability in established retail corridors should continue to support asking rents. However, with the construction pipeline expanding, rental performance will increasingly depend on location, retail format, and surrounding demographics.
DIRECT ASKING NNN RENT AND DIRECT VACANCY RATE

GROWTH CORRIDORS COMMAND A RETAIL RENT PREMIUM
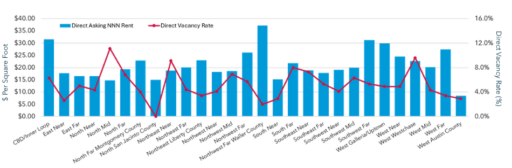
Retail rental rates continue to reflect significant differences across Greater Houston's submarkets, with established shopping destinations and rapidly expanding suburban corridors commanding premiums above the citywide average of $22.03 NNN per square foot.
Northwest Far Waller County recorded the highest asking rate at $37.14 per square foot, paired with just 2.0% direct vacancy. Although the submarket represents a relatively small inventory base, its performance highlights the growing influence of residential development and population expansion along Houston's western growth corridor.
Established retail destinations also maintained strong pricing.CBD/Inner Loop averaged $31.55 per square foot, followed by Southwest Far at $31.17 per square foot and Galleria/Uptown at $29.94 per square foot. West Far reached $27.44 per square foot, while Northwest Far averaged $26.09 per square foot, reflecting continued demand across Houston's western and northwestern submarkets.
Several premium-rent submarkets also reported vacancy below the citywide average of 5.6%. West Far recorded just 3.4% vacancy, North Far Montgomery County measured 4.0%, and Galleria/Uptown and West Near each posted 4.9%. Southwest Far followed at 5.3%.
The relationship between rental rates and vacancy reinforces an important trend: pricing power is increasingly influenced by population growth, residential expansion, and location. As new development moves farther into Houston's suburban corridors, tenant demand and rental performance will remain closely tied to surrounding demographics and retail accessibility.
NET ABSORPTION VS DIRECT VACANCY RATE
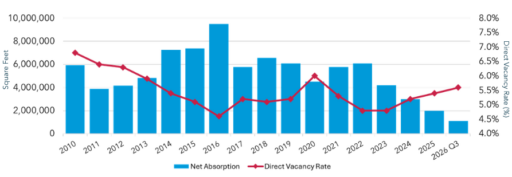
RETAIL DEMAND REMAINS POSITIVE AS VACANCY STAYS CONTAINED
Retail net absorption rebounded during Q3 2026, reaching 551,122 square feet compared with just 39,756 square feet in Q2. The improvement brought year-to-date absorption to approximately 1.1 million square feet, reflecting continued occupancy gains despite a more moderate leasing environment.
While absorption has slowed from the exceptionally strong levels recorded in previous years, Houston continues to demonstrate positive retail demand. Annual net absorption reached approximately 6.1 million square feet in 2022, followed by 4.2 million square feet in 2023, 3.0 million square feet in 2024, and 2.0 million square feet in 2025. The moderation reflects a market transitioning toward a more sustainable pace of occupancy growth.
Direct vacancy ended Q3 2026 at 5.6%, increasing just 20 basis points from 5.4% at year-end 2025. Despite fluctuations in leasing and absorption, vacancy has remained within a relatively narrow range for much of the past decade, reinforcing the stability of Houston's retail occupancy fundamentals.
Perhaps most notable is the market's long-term consistency. Houston has recorded positive annual net absorption every year since 2010, demonstrating sustained demand across multiple economic cycles. As the market enters the final quarter of 2026, continued population growth and expanding suburban communities should provide support for additional retail occupancy gains.
CONSTRUCTION PIPELINE
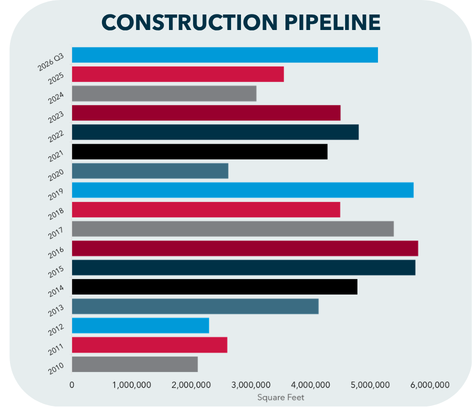
RETAIL DEVELOPMENT REBOUNDS TO HIGHEST LEVEL
Retail construction activity accelerated during Q3 2026, reaching 5.1 million square feet under construction, the highest level since 2019. The pipeline increased 15.0% quarter-over-quarter and 65.7% year-over-year, reflecting renewed developer confidence and expanding demand for retail space across Greater Houston.
Development remains concentrated in Houston's expanding suburban corridors, where population growth and residential construction continue to create opportunities for new retail projects. The Northwest Far submarket leads with approximately 966,000 square feet underway, followed by Southwest Far and East Far submarkets at approximately 689,000 square feet each. North Far Montgomery County and Northwest Far Waller County submarkets also reported significant activity, with approximately 663,000 and 581,000 square feet under construction, respectively. Together, these five submarkets account for nearly 70% of the market's construction pipeline.
While construction activity increased, quarterly deliveries declined to approximately 449,000 square feet, down from 867,000 square feet in Q2 2026. The combination of an expanding pipeline and fewer completions indicates that a greater volume of retail space remains under development, with additional supply expected to enter the market in future quarters.
Looking toward 2027, continued population growth and suburban expansion should support additional retail development. However, the timing of new deliveries, tenant preleasing, and the balance between supply and demand will be important factors in maintaining healthy occupancy levels.


QUARTERLY TREND ANALYSIS
| 2026 Q3 | 2026 Q2 | 2026 Q1 | 2025 Q4 | 2025 Q3 | |
|---|---|---|---|---|---|
| Direct Vacancy Rate | 5.6% | 5.6% | 5.4% | 5.4% | 5.4% |
| Direct Asking NNN Rent | $22.03 | $21.48 | $21.22 | $20.86 | $20.38 |
| Leasing Activity | 1,747,098 | 1,919,848 | 2,115,208 | 1,967,251 | 2,312,028 |
| Net Absorption | 551,122 | 39,756 | 523,849 | 531,906 | 956,460 |
| Construction Pipeline | 5,131,169 | 4,462,809 | 4,764,266 | 3,553,475 | 3,095,958 |
| Deliveries | 448,800 | 866,736 | 576,253 | 692,442 | 698,450 |
PRICING STRENGTH BUILDS AS DEVELOPMENT PIPELINE EXPANDS
Retail fundamentals remained relatively stable during Q3 2026, with direct asking NNN rents reaching a record $22.03 per square foot, up 2.6% from Q2 and 8.1% year over year. Direct vacancy held at 5.6% for the second consecutive quarter, reinforcing the market's pricing resilience despite more moderate leasing activity.
Leasing activity totaled approximately 1.75 million square feet, declining 9.0% from Q2 2026 and 24.4% from Q3 2025. Despite the slowdown, quarterly net absorption improved to 551,122 square feet, compared with just 39,756 square feet in the previous quarter. Through the first nine months of 2026, Houston recorded approximately 1.1 million square feet of positive net absorption.
Development activity continued to accelerate, with approximately 5.1 million square feet under construction at the end of Q3 2026, an increase of 65.7% year over year. Meanwhile, quarterly deliveries declined to approximately 449,000 square feet, down from 867,000 square feet in Q2, indicating that a significant volume of new retail space remains in the development pipeline.
Heading into Q4 2026, the relationship between rental growth, leasing activity, and new construction will be particularly important. Continued tenant demand and population growth should support well-positioned retail properties, while the expanding construction pipeline could introduce additional competition in select submarkets.
SHOPPING CENTERS OVERVIEW
| Type of Shopping Center | Inventory (SF) |
Direct Vacancy Rate |
NNN Rent Direct |
Current Quarter Leasing Activity (SF) |
YTD Leasing Activity (SF) |
Current Quarter Net Absorption (SF) |
YTD Net Absorption (SF) |
Construction Pipeline (SF) |
YTD Deliveries (SF) |
|---|---|---|---|---|---|---|---|---|---|
| Community, Neighborhood, & Strip Centers |
165,622,686 | 7.6% | $21.29 | 1,096,066 | 3,498,988 | (138,157) | (336,309) | 1,857,370 | 248,827 |
| Lifestyle Centers, Malls, & Regional Malls |
32,802,904 | 8.0% | $20.32 | 260,945 | 575,158 | (30,342) | 53,261 | 527,352 | 511,916 |
| Power Centers | 29,352,847 | 2.7% | $23.31 | 54,079 | 322,977 | 89,223 | 317,318 | 582,149 | 105,250 |
| Shopping Centers & Urban Centers |
638,699 | 4.0% | $34.00 | 0 | 0 | (5,718) | (1,218) | 0 | 0 |
RETAIL PERFORMANCE VARIES BY SHOPPING CENTER FORMAT
Shopping center performance varied across Greater Houston during Q3 2026, with differences in vacancy, rental rates, leasing activity, and absorption highlighting the importance of evaluating individual retail formats rather than relying solely on citywide averages.
Community, Neighborhood and Strip Centers represent the largest segment of Houston's shopping center inventory at approximately 165.6 million square feet. This category generated the greatest leasing activity, totaling nearly 3.5 million square feet year to date. However, direct vacancy measured 7.6%, while year-to-date net absorption remained negative at approximately 336,000 square feet, reflecting uneven performance across this broad retail category.
Power Centers demonstrated some of the strongest fundamentals, recording just 2.7% direct vacancy and an average asking NNN rent of $23.31 per square foot.
The category also posted approximately 317,000 square feet of positive year-to-date net absorption, indicating demand for well-located, large-format retail destinations.
Lifestyle Centers, Malls and Regional Malls recorded 8.0% direct vacancy and average asking rents of $20.32 per square foot, while maintaining modest positive year-to-date absorption. Shopping Centers and Urban Centers commanded the highest asking rent at $34.00 per square foot, although the category represents a relatively small portion of Houston's retail inventory.
The differences across retail formats reinforce an important trend: tenant mix, location, consumer demand, and property configuration continue to influence individual shopping center performance. As Houston's population expands, these distinctions will remain important for retailers, investors, and developers evaluating opportunities across the region.
KEY ACTIVITIES
Commencements
| Tenant | Center Name / Address | Square Feet | Submarket |
|---|---|---|---|
| Sam’s Club | 6611 Garth Road | 134,000 | East Far |
| 24 Hour Pickle | New Territory Center | 58,560 | Southeast Far |
| Undisclosed | 2783 Red Bluff Road | 40,000 | Southeast Near |
Leasing Activity
| Tenant | Center Name / Address | Square Feet | Submarket |
|---|---|---|---|
| The Home Depot | 22020 West Road | 134,808 | Northwest Far |
| Undisclosed | 10739-10777 North Freeway | 45,000 | North Near |
| Undisclosed | 500 Baybrook Mall | 42,000 | Southeast Far |
Sale Transactions
| Buyer / Seller | Building Name / Address | Square Feet | Submarket |
|---|---|---|---|
| Lincoln Property Company, New York Life Investments | Triyar Realty Group | Greenspoint Mall | 1,897,236 | North Mid |
| Dhanani Private Equity Group | Wu Properties | The Village at West Oaks | 262,000 | West Far |
| Dhanani Private Equity Group | Song Jong M | Westheimer Marketplace | 141,498 | West Far |
Deliveries
| Developer / Owner | Center Name / Address | Square Feet | Submarket |
|---|---|---|---|
| NewQuest | 2783 Red Bluff Road | 40,000 | Southeast Near |
| Pro Investment Group, Inc. | 11537 Antoine Drive | 23,689 | Northwest Mid |
| Property Commerce | 10189 West Grand Parkway South | 23,000 | Southwest Far |
Construction Pipeline
| Developer / Owner | Center Name / Address | Square Feet | Submarket |
|---|---|---|---|
| Fidelis | 4900 East Interstate 10 | 450,000 | East Far |
| NewQuest | 29355 Katy Freeway | 183,862 | Northwest Far Waller County |
| Main Street Commercial Properties | The Shops at La Marque | 179,642 | Southeast Far |
RETAIL PERFORMANCE VARIES BY SHOPPING CENTER FORMAT
Shopping center performance varied across Greater Houston during Q3 2026, with differences in vacancy, rental rates, leasing activity, and absorption highlighting the importance of evaluating individual retail formats rather than relying solely on citywide averages.
Community, Neighborhood and Strip Centers represent the largest segment of Houston's shopping center inventory at approximately 165.6 million square feet. This category generated the greatest leasing activity, totaling nearly 3.5 million square feet year to date. However, direct vacancy measured 7.6%, while year-to-date net absorption remained negative at approximately 336,000 square feet, reflecting uneven performance across this broad retail category.
Power Centers demonstrated some of the strongest fundamentals, recording just 2.7% direct vacancy and an average asking NNN rent of $23.31 per square foot.
The category also posted approximately 317,000 square feet of positive year-to-date net absorption, indicating demand for well-located, large-format retail destinations.
Lifestyle Centers, Malls and Regional Malls recorded 8.0% direct vacancy and average asking rents of $20.32 per square foot, while maintaining modest positive year-to-date absorption. Shopping Centers and Urban Centers commanded the highest asking rent at $34.00 per square foot, although the category represents a relatively small portion of Houston's retail inventory.
The differences across retail formats reinforce an important trend: tenant mix, location, consumer demand, and property configuration continue to influence individual shopping center performance. As Houston's population expands, these distinctions will remain important for retailers, investors, and developers evaluating opportunities across the region.
SALES OVERVIEW

RETAIL INVESTMENT PRICING IMPROVES DURING Q3 2026
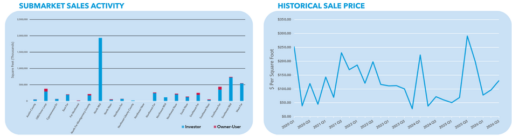
Retail investment pricing strengthened during Q3 2026, with average sale prices reaching $129.75 per square foot, up 34.6% from $96.40 in Q2 and 66.3% from $78.00 in Q1. The increase marks two consecutive quarters of higher average transaction pricing, although results continue to reflect differences in property type, location, and transaction size.
Notable transactions included the approximately 1.9 million-square-foot Greenspoint Mall sale involving Lincoln Property Company, New York Life Investments, and Triyar Realty Group. The property is slated for redevelopment into CityNorth Industrial Park, a planned 1.2 million-square-foot industrial distribution project. This transition highlights the evolving use of aging retail properties as developers reposition sites to accommodate changing market demand. Additional sales included The Village at West Oaks and Westheimer Marketplace, reflecting investment activity across established Houston retail submarkets.
While the improvement in average pricing is encouraging, quarterly fluctuations should be evaluated carefully. Changes in the composition of properties sold, tenant quality, and individual transaction characteristics can significantly influence average prices, making quarterly comparisons less representative of broader market appreciation.
Heading into 2027, Houston's population growth, stable retail occupancy, and expanding suburban communities should continue to support investor interest in well-located shopping centers. However, financing costs, lease structures, tenant credit, and individual submarket fundamentals will remain important considerations for buyers and sellers.
SUBMARKET OVERVIEW STATISTICS
| Submarket | Inventory (SF) |
Direct Vacancy Rate |
Direct Asking NNN Rent ($/SF) |
Current Quarter Leasing Activity (SF) |
YTD Leasing Activity (SF) |
Current Quarter Net Absorption (SF) |
YTD Net Absorption (SF) |
Construction Pipeline (SF) |
YTD Deliveries (SF) |
|---|---|---|---|---|---|---|---|---|---|
| CBD/Inner Loop | 30,834,199 | 6.3% | $31.55 | 44,321 | 283,673 | 113,720 | 40,778 | 162,870 | 15,732 |
| East Near | 5,849,960 | 2.6% | $17.68 | 4,100 | 35,462 | (4,624) | 17,194 | 0 | 0 |
| East Far | 9,614,157 | 5.0% | $16.51 | 17,757 | 40,492 | 148,711 | 135,948 | 688,704 | 30,500 |
| North Near | 11,892,046 | 4.3% | $16.48 | 72,093 | 108,182 | (105,080) | (107,559) | 57,195 | 16,050 |
| North Mid | 11,380,103 | 11.1% | $14.74 | 15,096 | 64,677 | 3,872 | 68,867 | 23,400 | 0 |
| North Far | 19,385,976 | 6.8% | $19.33 | 53,882 | 183,890 | (51,951) | (61,596) | 120,709 | 40,694 |
| North Far Montgomery County | 35,755,627 | 4.0% | $22.90 | 115,308 | 515,036 | 150,290 | 317,732 | 663,312 | 288,876 |
| North San Jacinto County | 455,808 | 0.0% | $15.00 | 0 | 0 | 0 | 2,731 | 0 | 0 |
| Northeast Near | 3,168,912 | 9.1% | $18.76 | 5,991 | 21,291 | 14,122 | (414) | 0 | 0 |
| Northeast Far | 10,458,766 | 4.4% | $20.02 | 181,072 | 302,831 | (10,231) | (48,913) | 80,899 | 0 |
| Northeast Liberty County | 3,297,062 | 3.4% | $22.94 | 0 | 2,610 | 6,900 | 5,663 | 16,007 | 17,832 |
| Northwest Near | 17,986,910 | 4.1% | $18.26 | 30,566 | 215,624 | 40,152 | (43,089) | 35,984 | 9,000 |
| Northwest Mid | 15,551,434 | 6.9% | $18.52 | 53,173 | 266,777 | 86,402 | 125,661 | 0 | 40,876 |
| Northwest Far | 37,751,083 | 5.7% | $26.09 | 366,380 | 929,682 | (78,845) | 127,682 | 965,647 | 309,935 |
| Northwest Far Waller County | 1,839,122 | 2.0% | $37.14 | 0 | 123,106 | 108,034 | 97,660 | 581,304 | 105,400 |
| South Near | 2,305,287 | 2.9% | $15.22 | 10,622 | 16,994 | 2,080 | (19,030) | 10,000 | 0 |
| South Far | 15,576,139 | 8.0% | $21.76 | 30,590 | 182,682 | (15,824) | 101,453 | 195,503 | 547,549 |
| Southeast Near | 31,413,141 | 7.3% | $18.84 | 223,883 | 650,827 | (180,106) | (204,046) | 242,357 | 61,072 |
| Southeast Far | 27,050,454 | 5.3% | $17.73 | 88,880 | 303,702 | 185,890 | 317,492 | 122,503 | 36,234 |
| Southwest Near | 20,214,692 | 4.1% | $19.05 | 66,058 | 169,211 | (67,549) | (46,909) | 34,000 | 26,368 |
| Southwest Mid | 21,032,231 | 6.3% | $19.96 | 54,976 | 282,272 | (38,894) | (3,030) | 105,332 | 8,050 |
| Southwest Far | 21,965,885 | 5.3% | $31.17 | 131,328 | 377,036 | 72,061 | 151,017 | 688,966 | 258,013 |
| West Galleria/Uptown | 4,428,970 | 4.9% | $29.94 | 0 | 45,499 | (7,936) | 13,053 | 10,000 | 0 |
| West Near | 12,432,985 | 4.9% | $24.44 | 45,024 | 174,441 | 22,559 | (32,456) | 15,000 | 0 |
| West Westchase | 2,431,698 | 9.6% | $22.64 | 816 | 97,080 | 27,586 | (29,789) | 0 | 15,000 |
| West Mid | 8,212,684 | 4.3% | $20.18 | 33,623 | 73,629 | 9,677 | 34,047 | 60,200 | 0 |
| West Far | 19,206,237 | 3.4% | $27.44 | 99,159 | 359,273 | 93,851 | 125,884 | 251,277 | 58,608 |
| West Austin County | 1,922,669 | 2.9% | $8.50 | 2,400 | 62,580 | 26,572 | 24,913 | 0 | 0 |
| Total Market | 403,383,537 | 5.6% | $22.03 | 1,747,098 | 5,888,559 | 551,122 | 1,114,727 | 5,131,169 | 1,891,789 |
SUBMARKET OVERVIEW STATISTICS
CONSUMER SPENDING SUPPORTS EXPERIENCE-DRIVEN RETAIL
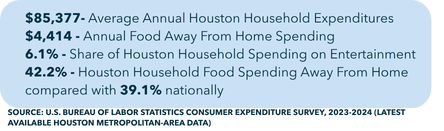
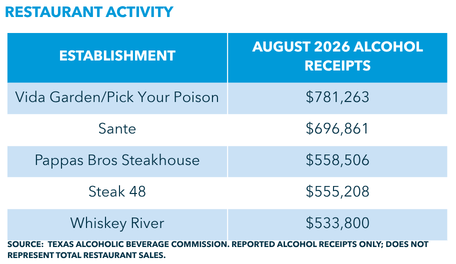
Consumer spending and population growth continue to provide a strong foundation for retail demand across Greater Houston. According to the U.S. Bureau of Labor Statistics, Houston-area households spent an average of $85,377 annually during 2023–2024, approximately 9.6% above the national average of $77,907. This spending activity reinforces the importance of the region's expanding consumer base in supporting shopping centers, restaurants, and service-oriented retail.
Dining and entertainment remain important components of household expenditures. Houston households spent an average of $4,414 annually on food away from home, representing 42.2% of total food expenditures, compared with 39.1% nationally. Entertainment accounted for 6.1% of annual household spending, highlighting the role of restaurants, entertainment venues, and experience-oriented concepts in the region's retail landscape.
Population growth is further expanding Houston's consumer base. Between July 2024 and July 2025, Harris County added approximately 48,700 residents, Montgomery County gained nearly 30,000, and Fort Bend County increased by more than 24,000. These gains are supporting retail opportunities across established neighborhoods and expanding suburban corridors, particularly in communities experiencing significant residential development.
As consumer preferences evolve, restaurants, entertainment concepts, and service-oriented businesses remain important components of shopping center tenant mixes. Retailers seeking locations near growing residential communities and established consumer destinations should continue to find opportunities throughout Greater Houston.


EV + RETAIL SPOTLIGHT: FROM PARKING SPACES TO REVENUE STREAM
TURN PARKING INTO POTENTIAL REVENUE
EV Charging Creates New Opportunities for Retail Property Owners
Additional income potential. Enhanced customer convenience. Strategic use of existing space.
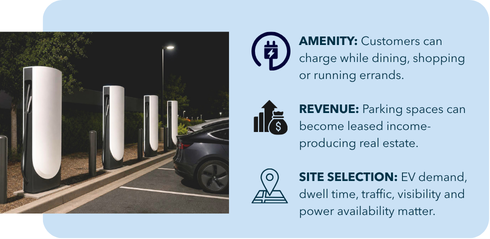
Terms, installation costs, and revenue opportunities vary by charging provider and individual agreement.
- Potential passive income with no upfront installation costs.
- Turnkey process.
- Long-term leases, potentially 10 years, with renewal options.
- Opportunity to generate addtional property income.
Electric vehicle charging is creating new opportunities for retail property owners to generate additional revenue while enhancing the customer experience. As charging infrastructure becomes more widely available, shopping centers, restaurants, and other retail destinations are increasingly being evaluated as potential charging locations.
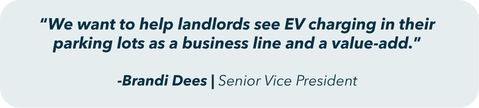
Brandi Dees, Senior Vice President with Lee & Associates – Houston, works with property owners, retailers, and charging providers to identify locations where EV infrastructure can complement existing retail operations. Site selection considerations include electrical capacity, traffic patterns, customer dwell time, visibility, and surrounding retail activity.
For landlords, underutilized parking spaces may represent an additional income opportunity. Through agreements with charging operators, property owners can potentially generate rental income while the provider manages equipment installation, operations, and maintenance. Depending on the agreement, these arrangements may require limited upfront investment from the property owner.
The benefits extend beyond rental income. Charging stations can encourage customers to visit nearby restaurants, grocery stores, entertainment venues, and service-oriented businesses while their vehicles charge. Traditional gas stations and convenience stores are also evolving into multi-energy destinations, combining conventional fueling with EV charging and complementary retail services.
Looking ahead, successful EV charging investments will depend on strategic site selection, available electrical infrastructure, and alignment with surrounding consumer demand. For Houston retail property owners, understanding these factors may create opportunities to diversify revenue while adapting to changing transportation and shopping preferences.
ECONOMIC UPDATE

ECONOMIC FUNDAMENTALS REMAIN SUPPORTIVE
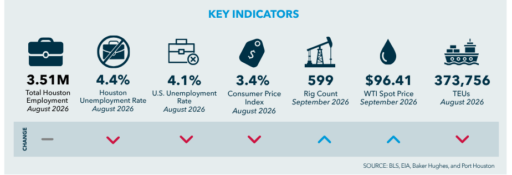
Houston's economy maintained relatively stable fundamentals during Q3 2026, supported by continued employment activity, population growth, and a diversified business environment. Total employment in the Houston metropolitan area reached approximately 3.51 million jobs in August, while the local unemployment rate measured 4.4%, compared with 4.1% nationally. These labor market conditions continue to provide an important foundation for consumer spending and retail demand throughout Greater Houston.
Inflation remains an important consideration for both consumers and retailers. The Consumer Price Index increased 3.4% year over year in August, reflecting continued pressure on household purchasing power and business operating expenses.
Nevertheless, Houston's growing population and expanding residential communities continue to support demand for everyday goods, restaurants, entertainment, and service-oriented retail.
Houston's energy and trade sectors also contribute to the region's broader economic activity. The U.S. rig count reached 599 in September, while WTI crude oil averaged $96.41 per barrel, according to the figures currently reported. Port Houston handled approximately 373,756 TEUs in August, reinforcing the importance of international trade and distribution activity to the regional economy.
For Houston's retail market, stable employment and continued activity across leisure, hospitality, and other consumer-oriented industries provide an important foundation for tenant demand. Population growth and household spending should continue to support restaurants, shopping centers, and service-oriented retail throughout Greater Houston.
RETAIL EMPLOYMENT GROWTH

GROWTH BY INDUSTRY
SEPTEMBER 2026 - YEAR-OVER-YEAR CHANGE
LEISURE & HOSPITALITY LEADS RETAIL-RELATED JOB GROWTH
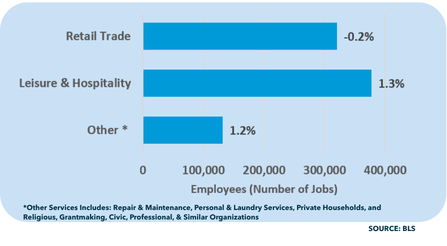
Leisure & Hospitality led Houston's retail-related employment growth during September 2026, increasing 1.3% year over year to approximately 376,900 jobs. The sector's continued expansion reflects demand across restaurants, entertainment, accommodations, and other hospitality-related businesses.
Other Services employment increased 1.2% to approximately 131,400 jobs, while Retail Trade declined modestly by 0.2% to 319,800 jobs. Although the decline in Retail Trade was relatively limited, it remains an important indicator as retailers balance consumer demand, labor costs, and evolving shopping patterns.
Growth in Leisure & Hospitality and Other Services reinforces the importance of restaurants, entertainment venues, and service-oriented businesses within Houston's retail tenant mix. Combined with population growth and expanding residential communities, these sectors continue to support demand for well-positioned retail space.

EMPLOYMENT GROWTH
2016-2026 EMPLOYMENT GROWTH TREND
RETAIL EMPLOYMENT GROWTH STABILIZES
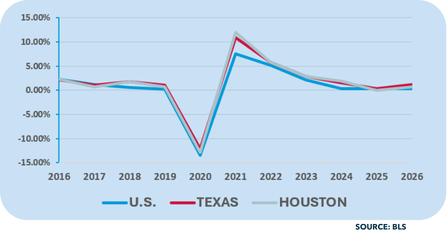
Retail-related employment growth has moderated following the sharp decline in 2020 and subsequent recovery during 2021 and 2022. After several years of significant fluctuations, employment trends have returned to a more stable pace as businesses adjust to changing consumer spending patterns and economic conditions.
In 2026, Houston's retail-related employment increased approximately 0.7%, compared with 1.2% across Texas and 0.3% nationally. While Houston's growth trailed the statewide average, it exceeded national performance, reflecting continued stability across the region's consumer-oriented industries.
Heading into 2027, population growth, household formation, and expanding suburban communities should provide support for retail-related employment. Restaurants, entertainment venues, and service-oriented businesses are expected to remain important contributors to Houston's evolving retail landscape.
OUTLOOK
HOUSTON RETAIL ENTERS Q4 2026 WITH HEALTHY FUNDAMENTALS
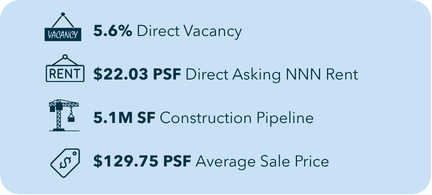
Houston's retail sector enters the final quarter of 2026 with stable occupancy, rising asking rents, and positive tenant demand. Direct vacancy held at 5.6% during Q3 2026, while average direct asking NNN rents reached a record $22.03 per square foot, representing an 8.1% increase year over year. Although leasing activity moderated, positive net absorption and relatively tight vacancy continue to support the market's underlying stability.
Development activity will be a defining trend heading into 2027. The construction pipeline expanded to approximately 5.1 million square feet, increasing 65.7% year over year and reaching its highest level since 2019. Much of this activity is concentrated in expanding suburban growth corridors, particularly Northwest Far, Southwest Far, East Far, and northern Montgomery and Waller counties. As projects move toward completion, preleasing activity, tenant demand, and the timing of new deliveries will become increasingly important in maintaining healthy occupancy levels.
Population growth and evolving consumer preferences should continue to influence retail demand. Expanding residential communities are creating opportunities for grocery-anchored shopping centers, restaurants, entertainment concepts, and service-oriented retail. Houston's household spending patterns also reinforce the importance of experience-driven retail, particularly as consumers seek convenient shopping, dining, and entertainment options closer to home.
Retail performance will likely become increasingly differentiated by submarket and property type. Established shopping destinations should continue attracting tenants seeking strong demographics and established customer bases, while emerging suburban corridors offer opportunities for retailers expanding alongside residential growth. Power Centers, which recorded just 2.7% direct vacancy during Q3 2026, demonstrate the continued appeal of well-positioned retail properties.

However, increasing construction activity may introduce additional competition in submarkets where new supply outpaces tenant demand.
Investment activity will remain another important consideration heading into 2027. Average retail transaction pricing increased to $129.75 per square foot during Q3 2026, although pricing continues to vary by property quality, location, tenant mix, and investment strategy. Well-located shopping centers with stable occupancy should remain attractive to investors, while financing costs and operating expenses will continue to influence acquisition and development decisions.
Looking toward 2027, Houston's retail market remains positioned for continued growth, supported by population expansion, stable occupancy, and demand for well-located retail space. While an expanding construction pipeline and evolving consumer spending patterns warrant attention, the region's diverse retail landscape and growing suburban communities provide a solid foundation for future investment and development opportunities.
HOUSTON RETAIL SUBMARKET MAP
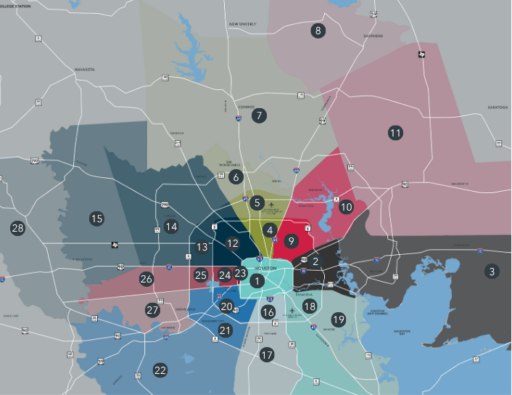
1 - CBD/Inner Loop
2 - East Near
3 - East Far
4 - North Near
5 - North Mid
6 - North Far
7 - North Far Montgomery County
8 - North San Jacinto County
9 - Northeast Near
10 - Northeast Mid
11 - Northeast Far
12 - Northeast Far Waller County
13 - South Near
14 - South Far
15 - Northwest Far Waller County
16 - South Near
17 - South Far
18 - Southeast Near
19 - Southeast Far
20 - Southwest Near
21 - Southwest Mid
22 - Southwest Far
23 - West Galleria/Uptown
24 - West Near
25 - West Westchase
26 - West Mid
27 - West Far
28 - West Austin County
RESEARCH TEAM
- MARY DOETTERL | RESEARCH DIRECTOR | [email protected]
- NATHAN KRUEGER
- KATIE MARTINEZ
- ELIZABETH WANG
Contact Us
"*" indicates required fields