Q3 2025 Industrial Market Report
INDUSTRIAL MARKET OVERVIEW
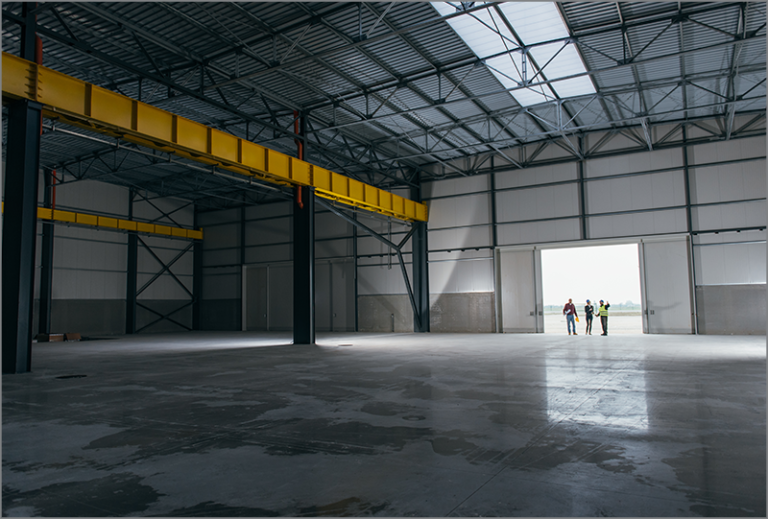
The Pacific Northwest industrial market continued to face headwinds in Q3 2025, with vacancy climbing to 8.79% as sluggish tenant demand and a wave of second-generation space returned to the market. Net absorption remained negative, though at a slower pace than Q2, suggesting some stabilization. Average annual NNN rents held firm at $15.50/SF, as newer Class A assets kept pricing buoyant despite softer demand in older product. Investment sales volume increased, with pricing drifting lower and cap rates ticking upward. Tariff-driven cost pressures on construction and imported goods added another layer of uncertainty, affecting both development pipelines and tenants reliant on trade. Even so, Washington’s strong trade corridors and export-driven user base provide a foundation for cautious optimism as the market looks to regain balance heading into 2026.

| MARKET INDICATORS | Q3 2025 | Q2 2025 | Q3 2025 | Q2 2025 | Q3 2024 |
|---|---|---|---|---|---|
| ↑ 12 Mo. Net Absorption (SF) | (1,041,157) | (1,377,305) | (1,041,157) | (1,377,305) | (3,243,430) |
| ↑ Vacancy Rate (%) | 8.79% | 8.60% | 8.79% | 8.60% | 7.80% |
| ↓ Avg NNN Asking Rate PSF (Annual) | $15.50 | $14.47 | $15.50 | $14.47 | $14.26 |
| ↑ Sale Price PSF | $237.00 | $224.45 | $237.00 | $224.45 | $238.00 |
| ↑ Cap Rate (%) | 5.85% | 5.60% | 5.85% | 5.60% | 5.72% |
| ↑ Under Construction (SF) | 5,487,421 | 5,413,360 | 5,487,421 | 5,413,360 | 10,910,795 |
| ↓ Inventory (SF) | 365,023,177 | 365,958,421 | 365,023,177 | 365,958,421 | 362,293,871 |