Multifamily Investment Review Spring 2026
STATE OF THE MARKET

As we move further into 2026, Seattle’s multifamily market is showing renewed stability after navigating several years of correction and hesitation. While the pace of recovery remains measured, key fundamentals including lack of supply, stabilizing vacancy, and rebounding investor activity are laying the groundwork for a more confident 2026 and beyond.

Vacancy Turning Point & Rent Growth Return

Local governments and private stakeholders are accelerating housing investment. Microsoft’s Brad Smith urged the Washington State Legislature to pass new pro-housing reforms. These initiatives indicate a political will to prioritize production and affordability alongside regulation.

Seattle’s new mayor, Katie Wilson, announced a $155 million commitment to support over 2,100 affordable units in January, the largest in city history. The initiative prioritizes production, preservation, and stabilization, including a new Anti-Displacement and Reparations Fund, rental assistance expansions, and funding for more than 2,100 affordable rental units. This commitment underscores the city’s long-term strategy to combat displacement and improve housing access, even amid broader fiscal tightening and softening federal support. The move reflects growing coordination between public investment and private sector development, with auspicious implications for long-term supply and affordability dynamics.

Economic Demand

The Seattle-Tacoma-Bellevue MSA is home to an estimated 4.2 million residents as of early 2026, and the City of Seattle recently crested 800K residents for the first time. Regional growth supported by steady population growth that is increasingly driven by international migration. While overall growth has moderated from the prior decade’s peak, the region continues to benefit from a highly educated and affluent population base, with median household income approaching $120,000, well above the national average.

SALES VOLUME PRICE PER UNIT
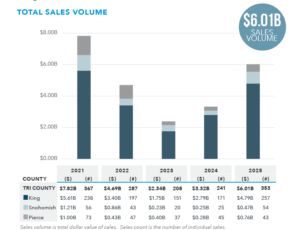
The total sales volume came in just over $6B with $3.86B in sales closing in H2. We often see stronger sales in the second half of the year and H2 2025 volume came in over 3x of the 2024 H2 volume ($1.12B). This was the highest volume since our 2021 high-water mark which was fueled by historically low interest rates.

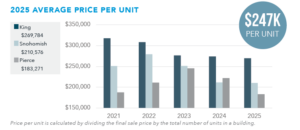
The Tri-County price per unit averaged nearly $247K, down slightly from the first half of 2025 ($251K). King County 2025 H2 average was $266K, Pierce County’s price per unit bumped up to $183K for the year, mainly driven by the per unit pricing cresting to $201K in H2, after a lackluster H1 average of $165K.


PRICE PER SQUARE FOOT CAP RATE
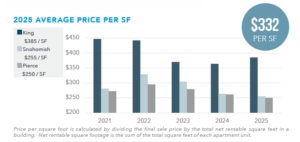
The Tri-County price per square foot averaged $332 in 2025, down nearly 10% from $365 for 2024. King County showed strengthening, averaging $385 for the year, up nearly 6% over 2024. Pierce County averaged $250 per square foot down over 4% from 2024. Snohomish County is down too, averaging $255 in 2025, down over 3% from the 2024 average.

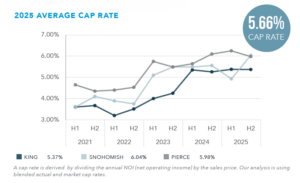
The Tri-County market experienced a slight increase in the average capitalization rate from 2024 (5.57%) to 2025 (5.66%). King County’s annual cap rate ticked up slightly from the 2024 average of 5.31% to 5.38% in 2025, however, the average dropped slightly from 5.38% in H1 to 5.37% in H2. While the Pierce County cap rates rose from 5.87% in 2024 to 6.12% in 2025, we saw a 4.5% drop in cap rates between H1 (6.25%) and H2 (5.98%).

Reach out to us today to schedule a confidential review of your property or portfolio—and take advantage of the opportunities in the market.