
Houston Citywide Office | Market Report Q1 2026
Executive Summary
The Houston office market posted mixed results in Q1 2026, giving back some of the momentum built in recent quarters while still pointing to gradual improvement ahead. The gap between Class A and Class B rents remains historically wide, with Trophy office buildings continuing to push record rents. Leasing activity held steady, vacancy ticked up slightly, and net absorption swung back negative, with the CBD driving much of the pullback. Even so, rents remain resilient despite only limited recovery in occupancy. The office market is still trending in the right direction, but it continues to work through periodic negative swings. Development remains constrained even as tenants continue to spring for new Trophy assets. Several major submarkets have no new construction in the pipeline, creating opportunities for developers that can secure financing and pre-leasing. Houston continues to benefit from population growth, and office employment rose 0.6%, helping buoy demand for office space. Vacancy remains significant, giving tenants options outside of new Trophy construction. Investment sales also remained steady, including several user/owner purchases that should help limit future supply returning to the market.
– BLAKE VIRGILIO, SIOR, CCIM | PRINCIPAL
Key Takeaways
Rent resilience continues to outpace occupancy recovery.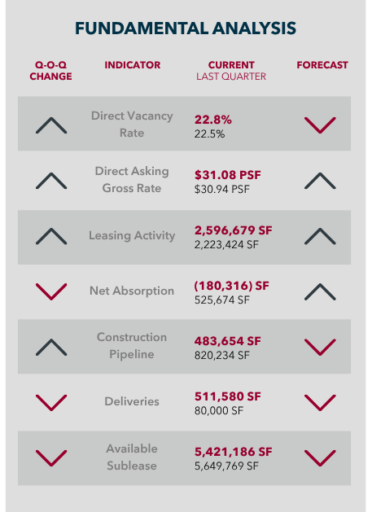
Direct asking rents reached $31.08 per square foot in Q1 2026 while direct vacancy remained elevated at 22.8%.
The flight to quality remains firmly in place.
Class A asking rents reached $36.48 per square foot versus $22.53 per square foot for Class B, reinforcing Houston’s persistent quality divide.
Recovery is moving forward, but it is not yet durable.
Although trailing 12-month net absorption remained positive at 1.5 million square feet, Q1 2026 slipped to negative 180,316 square feet.
Development remains highly constrained and increasingly selective.
Only 483,654 square feet is under construction, with 511,580 square feet delivered year-to-date.
Leasing activity remains constructive, but tenants are still highly selective.
Houston recorded 2.6 million square feet of quarterly leasing activity and 10.6 million square feet over the past 12 months.
Total vacancy remains a meaningful headwind.
Including sublease space, Houston’s total vacancy rate stands at 24.1%, compared with a 22.8% direct vacancy rate.
Capital markets activity continues, but buyer appetite remains selective.
Recent transactions point to continued interest in well located assets, though demand remains opportunity driven rather than broad-based.
Direct Asking Gross Rent vs. Direct Vacancy Rate
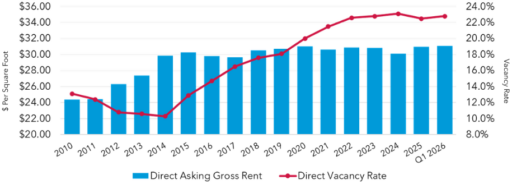
Direct asking gross rents in Houston averaged $30.95 per square foot in 2025, up 2.9% from $30.07 per square foot in 2024 and 27.1% above the $24.36 per square foot recorded in 2010.
Rents climbed steadily through the prior cycle, reaching $30.71 per square foot in 2019 and peaking at $31.05 per square foot in 2020. Even as COVID and shifting workplace patterns disrupted demand between 2019 and 2021, asking rents proved relatively resilient, easing just 1.4% to $30.61 per square foot in 2021 before stabilizing in the low-$30 range through 2025. That limited decline underscores landlords’ ability to defend pricing, particularly in newer, better-located, and higher-quality assets.
Vacancy told a different story. The direct vacancy rate rose from 18.1% in 2019 to 19.9% in 2020, then to 21.4% in 2021 and 22.8% in Q1 2026. The disconnect between stable rents and elevated vacancy remains one of the defining features of Houston’s office market, as tenants continue to favor quality over quantity. Looking ahead, the market should remain characterized by relatively steady pricing but only gradual improvement in occupancy, with the strongest performance concentrated in well-located Class A and other top-tier assets.
Direct Asking Gross Rent
Leasing Themes
- Flight to quality continues to shape leasing decisions
- Demand remains centered in newer, more efficient, amenity-rich buildings
- Older Class B assets must compete through pricing, capital improvements, or repositioning
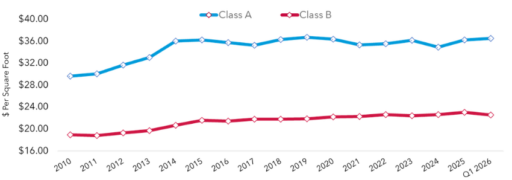
As of Q1 2026, Houston’s office market remains distinctly bifurcated between Class A and Class B product.
Class A asking rents reached $36.48 per square foot, up 1.0% from $36.12 per square foot in Q1 2025 and 4.4% above $34.93 per square foot in Q1 2024, placing top-tier assets back near prior-cycle highs. That resilience continues to reflect tenant preference for newer, more efficient, and amenity-rich buildings in prime submarkets. In contrast, Class B asking rents slipped 1.9% to $22.53 per square foot in Q1 2026 from $22.96 per square foot in Q4 2025, underscoring the weaker pricing power of older commodity space.
While Class B rents remain above long-term historical levels, growth has been uneven and far less durable than in Class A assets. The current rent spread between the two asset classes stands at roughly $13.95 per square foot, reinforcing the extent of Houston’s pricing divide. For landlords and investors, the message remains consistent: rent durability is concentrated in top-tier assets, while older properties must compete through pricing, capital investment, or repositioning. Absent a broader demand recovery, Class A should continue to outperform through 2026.
Net Absorption vs. Direct Vacancy Rate
What We’re Watching
- Consistency of quarterly absorption after Q1 2026 turned slightly negative
- Continued reduction in available sublease space across the market
- Leasing velocity in top-tier Class A assets versus older commodity inventory
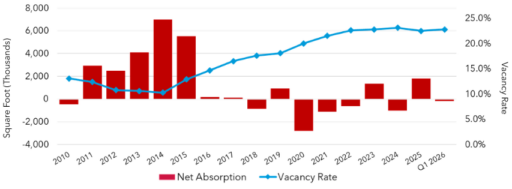
Houston’s office market entered 2026 with mixed signals, as the recovery in leasing activity seen in 2025 gave way to a modest setback in the first quarter.
Net absorption totaled 1.8 million square feet in 2025, a significant rebound from negative 1.0 million square feet in 2024 and the strongest annual performance since 2019. Even so, the market is still working through the effects of the 2020–2022 downturn, when cumulative negative absorption exceeded 4.5 million square feet.
In Q1 2026, net absorption turned slightly negative at 180,316 square feet, underscoring that tenant demand remains uneven and that leasing momentum has not yet become durable. Vacancy reflects the same stop-and-start recovery. After improving from 23.5% in Q4 2024 to 22.5% at year-end 2025, direct vacancy moved back up to 22.8% in Q1 2026. The uptick suggests that availability remains elevated even as select tenants continue to transact. For owners and investors, the message is clear: Houston’s office recovery is advancing, but it is not yet broad-based, with the healthiest demand still concentrated in well-located, higher-quality assets. Expect a choppy near-term leasing environment, with quarterly absorption likely to remain volatile through 2026.
Construction Pipeline
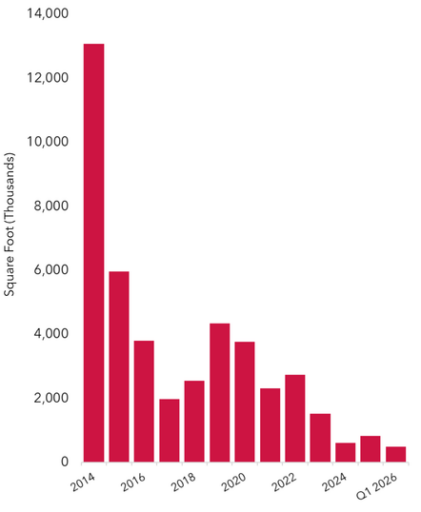
As of Q1 2026, approximately 483,654 square feet of office space is under construction, down from 820,234 square feet in Q4 2025 and well below both recent and historical development norms. The current pipeline stands in sharp contrast to prior development cycles. In 2014, more than 13.0 million square feet was under construction, and activity remained elevated through much of the mid-2010s before beginning a sustained decline.
Today’s limited pipeline suggests that most projects moving forward are build-to-suit or significantly pre-leased rather than speculative. For developers and investors, that restraint reflects a market still working through post-COVID demand shifts and elevated availability. In the near term, limited new supply should help prevent additional oversupply and support gradual market stabilization, particularly for newer, well-located assets. Until vacancy improves more meaningfully and tenant demand broadens, office construction is likely to remain constrained through the balance of 2026.
Quarterly Trend Analysis
| 2026 Q1 | 2025 Q4 | 2025 Q4 | 2025 Q2 | 2025 Q1 | |
|---|---|---|---|---|---|
| DIRECT VACANCY RATE | 22.8% | 22.5% | 22.7% | 23.0% | 23.2% |
| DIRECT ASKING GROSS RATE | $31.08 | $30.98 | $30.85 | $29.16 | $29.03 |
| LEASING ACTIVITY | 2,596,679 | 2,221,333 | 2,770,308 | 3,005,361 | 2,943,924 |
| SALE TRANSACTIONS | 2,557,003 | 2,740,735 | 10,500,886 | 5,335,483 | 4,575,290 |
| NET ABSORPTION | (180,316) | 534,925 | 587,980 | 51,737 | (711,694) |
| CONSTRUCTION PIPELINE | 483,654 | 820,234 | 869,351 | 741,700 | 597,413 |
| DELIVERIES | 511,580 | 80,000 | 49,117 | 0 | 40,000 |
| AVAILABLE SUBLEASE | 5,421,186 | 5,611,529 | 5,468,998 | 5,678,272 | 5,637,427 |
Houston’s office market continued to show gradual stabilization over the past year, but the recovery remains uneven and still tied to the post-COVID reset.
Direct vacancy improved modestly from 23.2% in Q1 2025 to 22.8% in Q1 2026, while direct asking rents rose from $29.03 per square foot to $31.08 per square foot, reinforcing that pricing has held up better than occupancy. Leasing activity remained relatively healthy, ranging from roughly 2.2 million to 3.0 million square feet per quarter, though net absorption was inconsistent and turned negative 180,316 square feet in Q1 2026 after three consecutive quarters of positive gains. Sales activity was also volatile, including a notable spike in Q3 2025, suggesting capital markets interest remains selective rather than broad-based.
Available sublease space trended modestly lower over the past year, while the construction pipeline narrowed to 483,654 square feet, reflecting continued caution from developers. Overall, Houston is stabilizing, but the office market has not fully recovered, and momentum remains concentrated in higher-quality, better-located assets.
Key Activities
| TENANT | BUILDING NAME/ADDRESS | SIZE (SF) | SUBMARKET |
|---|---|---|---|
| COMMENCEMENTS | |||
| Dow | CityCentre Six Office | 203,000 | Katy Freeway East |
| Vitol | The RO | 150,794 | Greenway Plaza |
| Boardwalk Pipelines | 990 Town and Country Boulevard | 143,253 | Katy Freeway East |
| LEASING ACTIVITY | |||
| Mitsubishi Corporation | 1100 Louisiana Street | 91,761 | Central Business District |
| Superior Energy | 8020 Katy Freeway | 56,256 | Katy Freeway East |
| Armstrong Lee & Baker | Brookhollow Central I | 36,476 | North Loop West |
| SUBLEASE | |||
| NOV | NOV Headquarters | 410,465 | Southwest/Beltway 8 |
| JP Morgan Chase | The Jones on Main | 122,365 | Central Business District |
| McDermott International | Energy Center V | 99,501 | Katy Freeway West |
| BUYER | SELLER | BUILDING NAME/ADDRESS | SIZE (SF) | SUBMARKET |
| SALE TRANSACTIONS | |||
| Interra Properties | Trigild | Greenway Plaza Portfolio | 4,311,629 | Greenway Plaza |
| Zhukovski Development | Credit Suisse | 919 Milam | 542,919 | Central Business District |
| AAA Investments | Silver Star Properties REIT | The Preserve at North Loop Portfolio | 225,628 | North Loop West |
| DEVELOPER | BUILDING NAME/ADDRESS | SIZE (SF) | SUBMARKET |
| DELIVERIES | |||
| Transwestern | The RO | 150,794 | Greenway Plaza |
| UNDER CONSTRUCTION | |||
| Service Corporation International | 1945 Allen Parkway | 210,000 | Midtown |
| Hanover Company | Autry Park | 127,651 | Midtown |
| Majestic Developers | Majestic HQ | 45,883 | Fort Bend County/Sugar Land |
Sales Overview
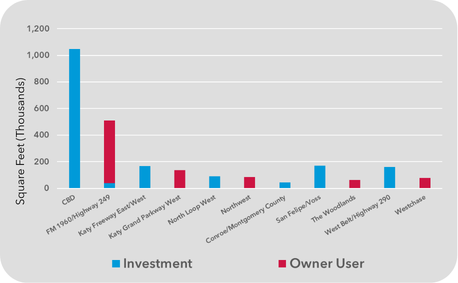
Submarket Sales Activity
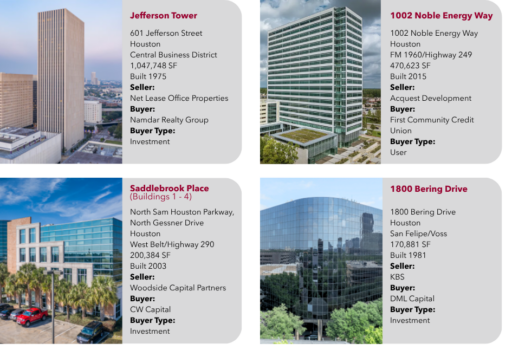
Houston’s office investment activity in Q1 2026 remained concentrated in a handful of submarkets, with the Central Business District leading by a wide margin. The CBD recorded roughly 1.05 million square feet in sales volume, driven by the 601 Jefferson Street transaction, while FM 1960/Highway 249 followed with about 471,000 square feet, anchored by the 1002 Noble Energy Way sale. West Belt/Highway 290 and San Felipe/Voss also posted meaningful activity at approximately 200,000 and 171,000 square feet, respectively.
Overall market sales totaled 2.56 million square feet in Q1 2026, down slightly from 2.74 million square feet last quarter, reinforcing that capital remains active but focused on select, higher-conviction opportunities.
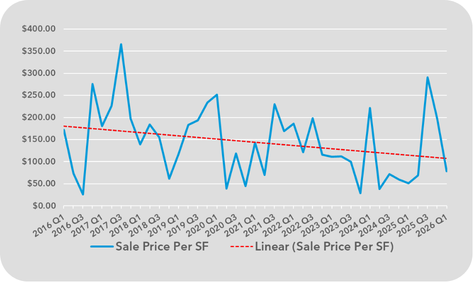
Historical Office Sale Price
Houston’s office sale pricing continues to reflect a market reset rather than broad stabilization. Historical pricing was highly volatile, with averages peaking above $300 per square foot in 2017–2018, then trending lower through the post-pandemic period. From 2019 to 2022, sale prices were uneven and occasionally rebounded above $200 per square foot, but those gains were not sustained. Values weakened again in 2023 and early 2024, often falling below $100 per square foot, and by Q1 2026 the market averaged about $78 per square foot.
Overall, pricing remains heavily influenced by individual asset quality, location, tenancy, and deal structure, with stronger assets still able to command a premium while older commodity product continues to trade at a discount.
Notable Sales
Office Market Statistics
| SUBMARKET / CLASS |
INVENTORY (SF) |
DIRECT VACANCY RATE |
SUBLEASE VACANCY RATE |
TOTAL VACANCY RATE |
PREVIOUS QUARTER DIRECT VACANCY RATE |
DIRECT ASKING GROSS RENT |
CURRENT QUARTER LEASING ACTIVITY (SF) |
12- MONTH LEASING ACTIVITY (SF) |
CURRENT QUARTER NET ABSORPTION (SF) |
12-Month NET ABSORPTION (SF) |
UNDER CONSTR. (SF) |
YTD DELIVERIES (SF) |
|---|---|---|---|---|---|---|---|---|---|---|---|---|
| TOTAL HOUSTON MARKET | ||||||||||||
| Class A | 138,744,337 | 24.00% | 1.60% | 25.50% | 23.60% | $36.48 | 1,875,520 | 7,200,167 | -150,169 | 1,249,153 | 483,654 | 511,580 |
| Class B | 99,537,196 | 21.20% | 1.00% | 22.20% | 21.10% | $22.53 | 721,159 | 3,387,302 | -30,147 | 259,172 | 0 | 0 |
| TOTAL | 238,281,533 | 22.80% | 1.30% | 24.10% | 22.50% | $31.08 | 2,596,679 | 10,587,469 | -180,316 | 1,508,325 | 483,654 | 511,580 |
| CENTRAL BUSINESS DISTRICT | ||||||||||||
| Class A | 39,409,171 | 24.30% | 1.50% | 25.80% | 24.00% | $43.08 | 440,054 | 1,558,776 | -116,233 | 825,305 | 0 | 0 |
| Class B | 11,289,811 | 27.70% | 0.00% | 27.70% | 27.80% | $13.80 | 405 | 25,822 | 11,286 | 21,338 | 0 | 0 |
| TOTAL | 50,698,982 | 25.10% | 1.10% | 26.20% | 24.90% | $38.88 | 440,459 | 1,584,598 | -104,947 | 846,643 | 0 | 0 |
| SUBURBAN | ||||||||||||
| Class A | 99,335,166 | 23.80% | 1.60% | 25.40% | 23.40% | $32.96 | 1,435,466 | 5,641,391 | -33,936 | 423,848 | 483,654 | 511,580 |
| Class B | 88,247,385 | 20.30% | 1.10% | 21.50% | 20.20% | $22.64 | 720,754 | 3,361,480 | -41,433 | 237,834 | 0 | 0 |
| TOTAL | 187,582,551 | 22.20% | 1.40% | 23.60% | 21.90% | $28.44 | 2,156,220 | 9,002,871 | -75,369 | 661,682 | 483,654 | 511,580 |
| ALLEN PARKWAY/MIDTOWN | ||||||||||||
| Class A | 2,740,049 | 17.90% | 2.20% | 20.10% | 17.10% | $37.56 | 11,751 | 229,443 | -21,174 | 1,710 | 337,651 | 0 |
| Class B | 3,900,155 | 8.70% | 0.20% | 8.90% | 8.30% | $30.84 | 16,539 | 81,606 | -17,293 | -21,638 | 0 | 0 |
| TOTAL | 6,640,204 | 12.50% | 1.10% | 13.50% | 11.90% | $35.40 | 28,290 | 311,049 | -38,467 | -19,928 | 337,651 | 0 |
| BAYTOWN | ||||||||||||
| Class B | 584,259 | 2.30% | 0.00% | 2.30% | 1.70% | $16.80 | 0 | 2,605 | -3,543 | -938 | 0 | 0 |
| TOTAL | 584,259 | 2.30% | 0.00% | 2.30% | 1.70% | $16.80 | 0 | 2,605 | -3,543 | -938 | 0 | 0 |
| BELLAIRE | ||||||||||||
| Class A | 1,269,957 | 24.70% | 0.10% | 24.80% | 24.10% | $30.84 | 975 | 52,181 | -8,410 | -33,331 | 0 | 0 |
| Class B | 3,004,137 | 13.30% | 0.10% | 13.50% | 13.40% | $27.60 | 37,333 | 94,827 | 1,993 | 11,827 | 0 | 0 |
| TOTAL | 4,274,094 | 16.70% | 0.10% | 16.80% | 16.60% | $29.76 | 38,308 | 147,008 | -6,417 | -21,504 | 0 | 0 |
| CONROE/MONTGOMERY COUNTY | ||||||||||||
| Class A | 60,000 | 0.00% | 0.00% | 0.00% | 0.00% | n/a | 0 | 0 | 0 | 0 | 0 | 0 |
| Class B | 536,888 | 11.20% | 0.00% | 11.20% | 12.50% | $32.16 | 8,046 | 19,816 | 7,102 | 54,217 | 0 | 0 |
| TOTAL | 596,888 | 10.00% | 0.00% | 10.00% | 11.20% | $32.16 | 8,046 | 19,816 | 7,102 | 54,217 | 0 | 0 |
| FORT BEND COUNTY/SUGAR LAND | ||||||||||||
| Class A | 2,543,122 | 33.7% | 0.2% | 33.9% | 33.2% | $34.08 | 22,565 | 107,705 | -11,198 | -24,435 | 0 | 0 |
| Class B | 2,330,968 | 12.5% | 0.5% | 13.0% | 12.2% | $23.16 | 22,863 | 125,393 | -6,414 | 156,276 | 0 | 0 |
| TOTAL | 4,874,090 | 23.5% | 0.4% | 23.9% | 23.2% | $30.48 | 45,428 | 233,098 | -17,612 | 131,841 | 0 | 0 |
| FM 1960/BELTWAY 8 | ||||||||||||
| Class A | 413,139 | 60.6% | 0.0% | 60.6% | 60.4% | 15.24 | 0 | 13,316 | -707 | -20,863 | 0 | 0 |
| Class B | 2,228,046 | 20.0% | 0.0% | 20.0% | 21.2% | 14.99 | 39,210 | 104,931 | 27,102 | 85,437 | 0 | 0 |
| TOTAL | 2,641,185 | 26.3% | 0.0% | 26.3% | 27.3% | $15.06 | 39,210 | 118,247 | 26,395 | 64,574 | 0 | 0 |
| FM 1960/HIGHWAY 249 | ||||||||||||
| Class A | 2,573,667 | 40.7% | 17.4% | 58.1% | 39.9% | $29.40 | 29,488 | 61,570 | -20,370 | 24,513 | 0 | 0 |
| Class B | 4,014,188 | 25.5% | 0.2% | 25.7% | 28.1% | $23.28 | 19,538 | 101,075 | 107,337 | 37,178 | 0 | 0 |
| TOTAL | 6,587,855 | 31.4% | 6.9% | 38.3% | 32.7% | $26.40 | 49,026 | 162,645 | 86,967 | 61,691 | 0 | 0 |
| GREENWAY PLAZA | ||||||||||||
| Class A | 7,869,288 | 27.1% | 0.3% | 27.4% | 26.8% | $38.64 | 25,842 | 333,497 | -23,463 | -159,169 | 146,003 | 0 |
| Class B | 3,065,945 | 20.6% | 0.2% | 20.8% | 19.7% | $30.00 | 38,788 | 108,958 | -27,076 | -51,419 | 0 | 0 |
| TOTAL | 10,935,233 | 25.3% | 0.3% | 25.5% | 24.8% | $25.52 | 64,630 | 442,455 | -50,539 | -210,588 | 146,003 | 0 |
| SUBMARKET / CLASS |
INVENTORY (SF) |
DIRECT VACANCY RATE |
SUBLEASE VACANCY RATE |
TOTAL VACANCY RATE |
PREVIOUS QUARTER DIRECT VACANCY RATE |
DIRECT ASKING GROSS RENT |
CURRENT QUARTER LEASING ACTIVITY (SF) |
12- MONTH LEASING ACTIVITY (SF) |
CURRENT QUARTER NET ABSORPTION (SF) |
12-Month NET ABSORPTION (SF) |
UNDER CONSTR. (SF) |
YTD DELIVERIES (SF) |
|---|---|---|---|---|---|---|---|---|---|---|---|---|
| KATY/GRAND PARKWAY WEST | ||||||||||||
| Class A | 1,638,724 | 20.7% | 0.0% | 20.7% | 19.6% | $36.00 | 3,122 | 203,607 | (19,348) | (97,270) | 0 | 0 |
| Class B | 778,693 | 8.8% | 0.0% | 8.8% | 8.6% | $32.88 | 14,733 | 30,301 | (1,352) | 4,858 | 0 | 0 |
| TOTAL | 2,417,417 | 16.9% | 0.0% | 16.9% | 16.0% | $35.04 | 17,855 | 233,908 | (20,700) | (92,412) | 0 | 0 |
| KINGWOOD/HUMBLE | ||||||||||||
| Class A | 270,000 | 22.2% | 0.0% | 22.2% | 0.0% | $0.00 | 0 | 0 | 0 | 0 | 0 | 0 |
| Class B | 1,172,156 | 5.1% | 0.6% | 5.7% | 5.1% | $20.76 | 4,598 | 14,792 | 1,974 | 7,237 | 0 | 0 |
| TOTAL | 1,442,156 | 8.3% | 0.5% | 8.8% | 4.2% | $20.76 | 4,598 | 14,792 | 1,974 | 7,237 | 0 | 0 |
| NASA/CLEAR LAKE | ||||||||||||
| Class A | 1,999,597 | 8.2% | 1.2% | 9.4% | 6.9% | $29.15 | 0 | 92,097 | 48,054 | 65,060 | 0 | 80,000 |
| Class B | 3,467,076 | 22.4% | 0.0% | 22.4% | 23.1% | $22.58 | 20,228 | 112,002 | 27,186 | (654) | 0 | 0 |
| TOTAL | 5,466,673 | 17.2% | 0.5% | 17.6% | 17.3% | $23.48 | 20,228 | 204,099 | 75,240 | 64,406 | 0 | 80,000 |
| NORTH BELT/GREENSPOINT | ||||||||||||
| Class A | 4,571,747 | 48.9% | 0.3% | 49.2% | 50.4% | $18.99 | 8,628 | 90,982 | 66,516 | 47,056 | 0 | 0 |
| Class B | 6,707,996 | 37.6% | 0.1% | 37.7% | 37.4% | $15.15 | 45,313 | 190,103 | (11,722) | (108,602) | 0 | 0 |
| TOTAL | 11,279,743 | 42.2% | 0.2% | 42.4% | 42.7% | $17.40 | 53,941 | 281,085 | 54,794 | (61,546) | 0 | 0 |
| NORTH LOOP WEST | ||||||||||||
| Class A | 1,508,584 | 25.4% | 0.0% | 25.4% | 17.0% | $24.72 | 34,923 | 124,508 | (126,910) | (61,801) | 0 | 0 |
| Class B | 2,156,023 | 18.8% | 0.8% | 19.6% | 19.0% | $20.47 | 47,696 | 202,330 | 4,460 | 2,502 | 0 | 0 |
| TOTAL | 3,664,607 | 21.5% | 0.5% | 22.0% | 18.1% | $22.76 | 82,619 | 326,838 | (122,450) | (59,299) | 0 | 0 |
| NORTHEAST | ||||||||||||
| Class A | 273,223 | 1.0% | 0.0% | 1.0% | 1.0% | n/a | 0 | 0 | 0 | 0 | 0 | 0 |
| Class B | 514,631 | 3.2% | 0.0% | 3.2% | 2.2% | $24.53 | 2,487 | 11,002 | (5,080) | (2,768) | 0 | 0 |
| TOTAL | 787,854 | 2.4% | 0.0% | 2.4% | 1.8% | $24.53 | 2,487 | 11,002 | (5,080) | (2,768) | 0 | 0 |
| NORTHWEST | ||||||||||||
| Class A | 1,003,410 | 23.3% | 0.9% | 24.3% | 22.9% | $20.53 | 16,908 | 132,358 | (4,168) | 74,841 | 0 | 0 |
| Class B | 3,994,192 | 8.8% | 1.0% | 9.8% | 8.4% | $16.73 | 7,268 | 68,731 | (13,851) | (13,754) | 0 | 0 |
| TOTAL | 4,997,602 | 11.7% | 1.0% | 12.7% | 11.3% | $18.28 | 24,176 | 201,089 | (18,019) | 61,087 | 0 | 0 |
| RICHMOND/FOUNTAINVIEW | ||||||||||||
| Class B | 738,557 | 16.1% | 0.0% | 16.1% | 19.7% | $16.26 | 4,002 | 6,960 | 26,927 | 22,482 | 0 | 0 |
| TOTAL | 738,557 | 16.1% | 0.0% | 16.1% | 19.7% | $16.26 | 4,002 | 6,960 | 26,927 | 22,482 | 0 | 0 |
| SAN FELIPE/VOSS | ||||||||||||
| Class A | 2,398,656 | 26.8% | 2.7% | 29.5% | 28.5% | $31.78 | 44,836 | 209,690 | 40,739 | 131,794 | 0 | 0 |
| Class B | 2,797,442 | 24.3% | 0.0% | 24.3% | 23.1% | $23.04 | 68,694 | 169,694 | (33,696) | 3,011 | 0 | 0 |
| TOTAL | 5,196,098 | 25.4% | 1.2% | 26.7% | 25.6% | $26.85 | 113,530 | 379,384 | 7,043 | 134,805 | 0 | 0 |
| SOUTH | ||||||||||||
| Class A | 586,103 | 3.5% | 0.0% | 3.5% | 3.5% | $29.60 | 0 | 11,062 | 0 | 12,166 | 0 | 0 |
| Class B | 498,805 | 7.1% | 0.0% | 7.1% | 7.1% | $29.70 | 0 | 428 | 144 | (8,602) | 0 | 0 |
| TOTAL | 1,084,908 | 5.2% | 0.0% | 5.2% | 5.2% | $29.66 | 0 | 11,490 | 144 | 3,564 | 0 | 0 |
| SOUTH MAIN/MEDICAL CENTER | ||||||||||||
| Class A | 250,000 | 0.0% | 0.0% | 0.0% | 0.0% | n/a | 0 | 0 | 0 | 0 | 0 | 0 |
| Class B | 1,408,148 | 9.3% | 0.0% | 9.3% | 7.9% | $18.25 | 3,005 | 69,362 | (19,876) | 31,647 | 0 | 0 |
| TOTAL | 1,658,148 | 7.9% | 0.0% | 7.9% | 6.7% | $18.25 | 3,005 | 69,362 | (19,876) | 31,647 | 0 | 0 |
| SOUTHEAST | ||||||||||||
| Class B | 228,543 | 0.0% | 0.0% | 0.0% | 0.0% | n/a | 0 | 0 | 0 | 0 | 0 | 0 |
| TOTAL | 228,543 | 0.0% | 0.0% | 0.0% | 0.0% | n/a | 0 | 0 | 0 | 0 | 0 | 0 |
| SOUTHWEST/BELTWAY 8 | ||||||||||||
| Class A | 1,070,041 | 34.5% | 0.0% | 34.5% | 34.6% | $17.76 | 8,111 | 27,955 | 1,029 | (43,821) | 0 | 0 |
| Class B | 7,080,360 | 19.3% | 6.1% | 25.4% | 18.5% | $20.90 | 16,882 | 172,346 | (56,645) | 170,468 | 0 | 0 |
| TOTAL | 8,150,401 | 21.3% | 5.3% | 26.6% | 20.7% | $19.94 | 24,993 | 200,301 | (55,616) | 126,647 | 0 | 0 |
| SOUTHWEST FAR | ||||||||||||
| Class A | 80,536 | 38.1% | 0.0% | 38.1% | 42.1% | $37.53 | 4,536 | 4,536 | 3,264 | 7,517 | 0 | 0 |
| Class B | 528,028 | 0.4% | 0.0% | 0.4% | 0.4% | n/a | 0 | 0 | 0 | 53,600 | 0 | 0 |
| TOTAL | 608,564 | 5.4% | 0.0% | 5.4% | 5.9% | $37.53 | 4,536 | 4,536 | 3,264 | 61,117 | 0 | 0 |
| WEST BELT/HIGHWAY 290 | ||||||||||||
| Class A | 3,289,640 | 23.9% | 3.2% | 27.1% | 24.2% | $31.82 | 137,623 | 291,920 | 10,471 | 151,211 | 0 | 0 |
| Class B | 2,209,060 | 31.3% | 0.5% | 31.8% | 30.4% | $24.18 | 2,492 | 33,634 | (18,248) | 6,730 | 0 | 0 |
| TOTAL | 5,498,700 | 26.9% | 2.1% | 29.0% | 26.7% | $28.29 | 140,115 | 325,554 | (7,777) | 157,941 | 0 | 0 |
| WEST LOOP/GALLERIA | ||||||||||||
| Class A | 17,609,603 | 32.3% | 0.8% | 33.2% | 32.1% | $39.61 | 205,703 | 1,005,802 | (35,362) | 119,596 | 0 | 0 |
| Class B | 6,633,561 | 31.2% | 0.3% | 31.5% | 31.5% | $29.41 | 50,001 | 312,386 | 19,372 | 1,075 | 0 | 0 |
| TOTAL | 24,243,164 | 32.0% | 0.7% | 32.7% | 32.0% | $37.07 | 255,704 | 1,318,188 | (15,990) | 120,671 | 0 | 0 |
| WESTCHASE | ||||||||||||
| Class A | 9,865,026 | 26.2% | 0.9% | 27.1% | 26.7% | $32.17 | 255,411 | 652,595 | 48,130 | (76,195) | 0 | 0 |
| Class B | 7,390,901 | 25.0% | 3.6% | 28.6% | 24.7% | $19.16 | 39,216 | 286,800 | (24,607) | 49,028 | 0 | 0 |
| TOTAL | 17,255,927 | 25.7% | 2.1% | 27.7% | 25.8% | $27.67 | 294,627 | 939,395 | 23,523 | (27,167) | 0 | 0 |
| WOODLANDS | ||||||||||||
| Class A | 13,444,932 | 8.2% | 1.0% | 9.2% | 8.4% | $47.74 | 116,923 | 706,976 | 31,981 | 411,409 | 0 | 0 |
| Class B | 3,915,247 | 14.7% | 2.5% | 17.1% | 14.6% | $26.99 | 31,542 | 196,375 | (1,176) | (65,716) | 0 | 0 |
| TOTAL | 17,360,179 | 9.7% | 1.3% | 11.0% | 9.8% | $41.70 | 148,465 | 903,351 | 30,805 | 345,693 | 0 | 0 |
Outlook
Houston’s office market is moving through a gradual, quality-driven recovery, but the pace remains uneven and highly asset-specific.
- The sharp disruption caused by COVID continues to shape occupier behavior, leasing patterns, and development decisions across Houston and other major office markets. While pricing has remained relatively resilient, vacancy is still elevated, absorption remains inconsistent, and demand continues to concentrate in the highest-quality buildings.
- Looking ahead, Houston should continue to stabilize through the balance of 2026, though the recovery is unlikely to be broad-based or linear. Tenants remain active, but they are leasing more selectively, favoring newer, amenity-rich, efficient buildings in well-located submarkets. That dynamic should continue to support Class A rent performance, while older Class B and commodity assets remain under greater pressure from elevated availability, slower leasing velocity, and the need for capital improvements or repositioning.
- On the supply side, the limited construction pipeline is a constructive sign for long-term market balance. With few speculative projects moving forward, Houston is less likely to face meaningful new supply pressure in the near term. Instead, the market’s recovery will depend more on the gradual absorption of existing space, improvement in tenant confidence, and continued normalization of office-using employment. Capital markets activity should remain selective as investors continue to favor well-located, institutional-quality product and approach challenged assets with greater caution.
- Overall, Houston’s office market is expected to remain defined by stable pricing, selective leasing, and slow but measurable recovery. The strongest performance should remain concentrated in premier assets and submarkets, while the broader market continues to work through the lasting effects of the post-COVID reset. Incremental improvement is underway, but full recovery will likely take time.
Key Risks & Opportunities
- Continued flight to quality supporting premier assets
- Limited new supply helping restrain future oversupply
- Elevated vacancy and uneven absorption delaying full recovery
Economic Update
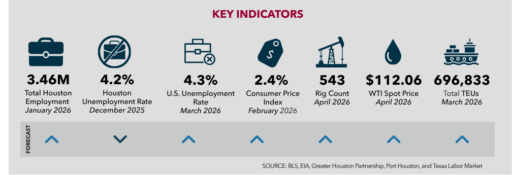
Houston’s economy remains supportive of office demand, with steady employment, moderating inflation, and continued activity across the region’s core industries.
Total employment stood at approximately 3.46 million entering 2026, while unemployment remained in the low-4% range and broadly in line with the national average. Hiring across professional services, healthcare, trade, and transportation continues to reinforce the region’s diversified employment base.
Inflation has moderated from prior-cycle highs, giving occupiers greater visibility into operating costs and business planning. At the same time, Houston continues to benefit from the scale of its energy complex, global trade connections, and population growth, all of which support broader business activity. Port activity and continued investment across infrastructure, logistics, and services also remain supportive of regional growth.
For the office market, the key theme is stability rather than acceleration. Economic conditions remain constructive enough to support leasing activity, but not yet strong enough to produce a broad-based office rebound. As a result, demand should continue to favor higher-quality, well-located buildings, while the broader recovery in occupancy remains gradual through 2026.
Office Employment Growth
Growth By Industry
January 2026 – Year-Over-Year Change
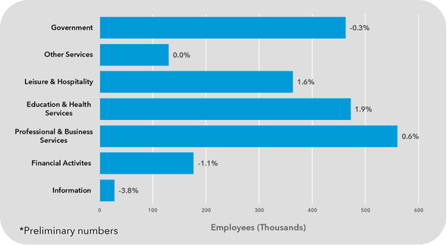
Office employment growth remains modest, with gains concentrated in service-oriented sectors and declines in information and financial activities.
Houston’s office sectors showed mixed year-over-year performance as of January 2026. Professional and business services, the largest office-using sector, grew 0.6% to 560,400 jobs, reflecting steady though moderating demand for corporate services. Education and health services increased 1.9% to 472,300 jobs, while leisure and hospitality rose 1.6%, supporting broader employment growth across the region.
However, several traditional office sectors remained under pressure. Information declined 3.8%, and financial activities fell 1.1%, signaling continued softness in tech- and finance-related employment. Government employment edged down 0.3%, while other services were essentially flat. Overall, Houston’s office employment base is still expanding, but growth is increasingly concentrated in select service sectors rather than broad-based across all categories. That pattern supports gradual improvement in office demand, but it also reinforces the market’s uneven recovery.
Employment Growth
January 2026 – 10 Year Change
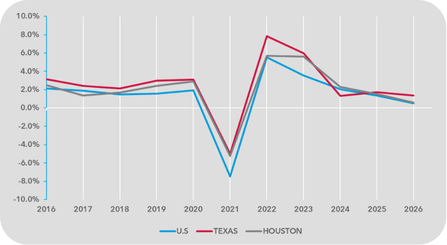
Houston’s office employment growth has moderated after a strong post-pandemic rebound, returning to a more sustainable pace.
Over the past decade, local office employment trends have generally tracked Texas and the U.S., with periods of outperformance during stronger expansion cycles. From 2016 through 2020, Houston recorded annual growth between 1.4% and 2.9%, supported by professional services expansion, energy-sector stability, and population growth.
The pandemic drove a sharp contraction in 2021, when Houston office employment fell 5.2% slightly less severe than the national decline but steeper than Texas. That pullback was followed by a strong rebound in 2022 and 2023, when growth reached 5.7% and 5.6%, respectively, as office-using sectors recovered. Since 2024, growth has eased back to more measured levels, with Houston rising 1.5% in 2025 and 0.6% in 2026. The moderation suggests the market is moving out of recovery mode and into a slower, more normalized expansion cycle, which should support office demand growth but not enough to materially compress vacancy in the near term.
Submarket Map
1 – Central Business District
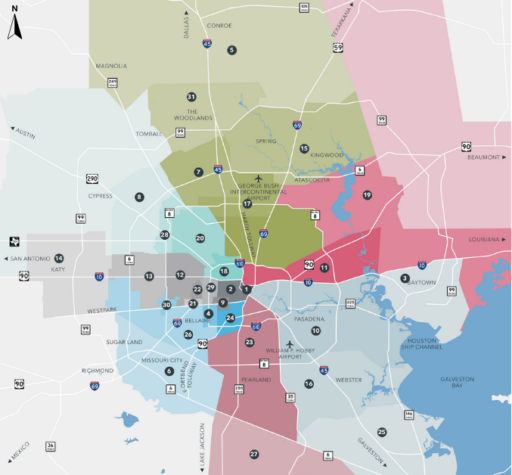
2 – Allen Parkway/Midtown
3 – Baytown
4 – Bellaire
5 – Conroe/Montgomery County
6 – Fort Bend County/Sugar Land
7 – FM 1960/Beltway 8
8 – FM 1960/Hwy 249
9 – Greenway Plaza
10 – Gulf Freeway/Pasadena
11 – I-10 East
12 – Katy Freeway East
13 – Katy Freeway West
14 – Katy/Grand Parkway West
15 – Kingwood/Humble
16 – NASA/Clear Lake
17 – North Belt/Greenspoint
18 – North Loop West
19 – Northeast
20 – Northwest
21 – Richmond/Fountainview
22 – San Felipe/Voss
23 – South
24 – South Main/Medical Center
25 – Southeast
26 – Southwest/Beltway 8
27 – Southwest Far
28 – West Belt/Highway 290
29 – West Loop/Galleria
30 – Westchase
31 – Woodlands
Office Advisors
Managing Principal
Landlord representation
Principal
Principal
Principal
Executive Vice President
Director
Director
Associate
Tenant Representation
Principal
Associate
Associate
Research Team
- MARY DOETTERL | RESEARCH DIRECTOR | | [email protected]
- NATHAN KRUEGER | RESEARCH ANALYST
- JASMINE HUANG | JUNIOR RESEARCH ANALYST