
Houston Citywide Office | Market Report Q2 2026
Executive Summary
Houston’s office market showed modest improvement during the second quarter, recording positive net absorption following several quarters of occupancy loss. The increase indicates that tenant move-ins modestly outpaced move-outs, promising stable fundamentals. The market remains highly bifurcated as more than 60% of the leased square footage was concentrated in newer Trophy and Class A properties with modern finishes. Commodity Class B and C properties will likely continue to face pricing pressure as they struggle to gain momentum as tenants are more deliberate in making real estate decisions, often reducing their overall footprints while upgrading to higher-quality space that better supports today’s workplace strategies.
Looking ahead, the local office market is expected to continue its gradual improvement over the next six to twelve months as Houston has recently benefitted from corporate relocations and merger activity, with many companies selecting locations along the Katy Freeway/Energy Corridor, further reinforcing the corridor’s position as the premier business district for oil and gas, professional services and engineering companies. Limited new office construction should constrain future supply as capital markets remain cautious toward the office sector and most proposed developments require substantial preleasing before breaking ground. Although challenges persist in its aging office inventory, Houston’s diverse economy, continued population growth, and premier landing spot for large companies position the market for measured improvement over the coming year.
-TRAVIS TAYLOR, PRINCIPAL
Key Takeaways
Office market fundamentals continued to improve.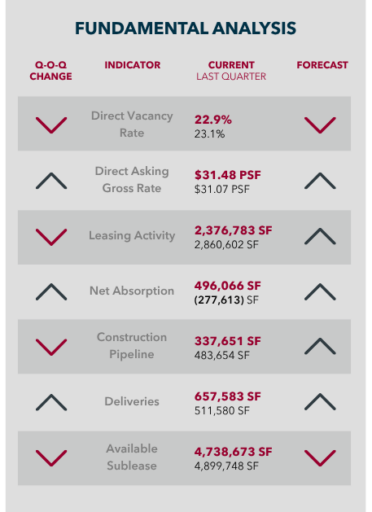
Direct asking gross rents increased 1.3% quarter over quarter while direct vacancy declined 20 basis points, providing additional evidence that market conditions continue to stabilize.
Flight to quality remains the market’s defining trend.
Class A properties continue to outperform as occupiers prioritize workplace quality, operational efficiency, and employee experience.
Positive absorption returned in a meaningful way.
Net absorption improved by more than 773,000 square feet from the prior quarter, signaling healthier tenant demand and gradual occupancy gains.
Developers remain highly disciplined.
The construction pipeline declined another 30.2% quarter over quarter to just 337,651 square feet, limiting future supply and supporting long-term market balance.
Capital remains selective, but active.
The acquisition of Greenway Plaza highlighted continued investor interest in premier office assets, while value-add opportunities continue attracting disciplined capital.
Employment continues to support office demand.
Steady job growth in professional services and healthcare provides a stable foundation for future leasing activity despite slower overall hiring.
Houston’s office market continues its gradual transition toward recovery.
Improving absorption, resilient rental rates, limited new construction, and selective investment activity all point toward continued stabilization through the remainder of 2026.
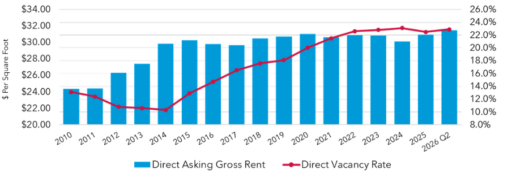
Direct Asking Gross Rent VS. Direct Vacancy Rate
PRICING STABILITY & IMPROVING MARKET FUNDAMENTALS
Office market fundamentals continued to improve during the second quarter, as direct asking gross rents increased while direct vacancy edged lower. The weighted average asking gross rent rose to $31.48 per square foot, a 1.3% increase from $31.08 in Q1 2026 and 4.1% above the 2025 annual average of $30.26 per square foot. At the same time, the direct vacancy rate improved from 23.1% to 22.9%, a 20-basis-point decline, representing a 0.9% quarter-over-quarter improvement. Although vacancy remains historically elevated, these trends suggest landlords continue to maintain pricing discipline as tenant demand gradually improves.
Houston’s ability to preserve rental rates despite elevated vacancy remains one of the market’s defining characteristics. Rather than competing solely on asking rents, many landlords continue to differentiate through tenant improvement allowances, leasing concessions, and building upgrades, particularly within Class A properties. As a result, asking rents have remained remarkably stable even as occupiers continue to lease space more selectively.
Looking ahead, limited new office construction and gradually improving market fundamentals should continue supporting rental rates through the balance of 2026. While vacancy is expected to remain elevated, improving occupancy and restrained new supply position the market for a measured recovery, with the strongest performance concentrated in well-located, institutional-quality office assets.
Direct Asking Gross Rent
Key Market Insights
- Flight to quality continues to reshape leasing decisions across Houston’s office market.
- Occupiers are placing greater emphasis on workplace quality, employee experience, and operational efficiency.
- Landlords investing in amenities, modernization, and flexible work environments remain best positioned to attract and retain tenants.
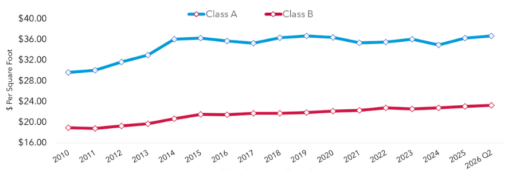
FLIGHT TO QUALITY CONTINUES TO DRIVE LEASING
Tenant preference for higher-quality office space continued to define leasing activity throughout Houston’s office market during the second quarter, reinforcing the ongoing flight-to-quality trend. Class A asking gross rents increased to $36.63 per square foot, up 1.2% from Q1 2026 and 5.0% above 2024 levels. Meanwhile, Class B asking gross rents rose to $23.23 per square foot, a 0.9% quarterly increase and 2.1% above 2024. Although both asset classes posted modest rental growth, Class A properties continue to outperform as occupiers prioritize newer, amenity-rich buildings in premier locations.
The pricing gap between Class A and Class B office space now stands at approximately $13.40 per square foot, reinforcing the market’s continued shift toward higher-quality assets. Corporate occupiers remain focused on workplace quality, operational efficiency, and employee experience, allowing premier buildings to maintain stronger pricing power despite elevated vacancy. In contrast, many Class B landlords continue to compete through rental concessions, capital improvements, and repositioning strategies to attract and retain tenants.
Looking ahead, Class A properties should remain well positioned to capture the strongest leasing demand as limited new construction and selective tenant activity continue supporting rental performance. While Class B buildings are expected to benefit from broader market stabilization over time, leasing activity will likely remain concentrated in higher-quality assets throughout the remainder of 2026.
Net Absorption vs. Direct Vacancy Rate
Market Insights
- Positive absorption supporting a gradual market recovery.
- Limited new construction helping improve long-term supply fundamentals.
- Flight to quality continues to drive leasing decisions.
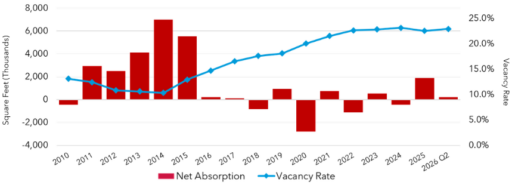
MARKET RECOVERY GAINS MOMENTUM
Houston’s office market posted encouraging momentum during the second quarter as net absorption rebounded to 496,066 square feet, improving by more than 773,000 square feet from the 277,613 square feet of negative absorption recorded in Q1 2026. At the same time, the direct vacancy rate declined from 23.1% to 22.9%, marking a 20-basis-point improvement and providing additional evidence that market fundamentals are gradually stabilizing.
While quarterly absorption has remained volatile over the past several years, recent leasing activity suggests tenants continue to expand selectively, with demand concentrated in newer, well-located Class A buildings. The continued flight-to-quality is allowing premier assets to capture a greater share of leasing activity, while older commodity office properties continue to experience slower occupancy gains and greater competitive pressure.
Looking ahead, sustained positive absorption will remain one of the most important indicators of Houston’s office recovery. Although vacancy remains elevated by historical standards, limited new construction, improving tenant confidence, and continued leasing activity should support a gradual reduction in available space through the balance of 2026. The pace of recovery is expected to remain measured, but current trends suggest the market is continuing to move in the right direction.
Occupancy Recovery & Net Absorption
Market Insights
Houston’s return to positive net absorption, combined with improving workplace attendance, suggests occupier confidence continues to strengthen. While leasing activity remains concentrated in high-quality Class A buildings, limited new construction and improving workplace utilization continue supporting a gradual recovery in office fundamentals through the remainder of 2026.
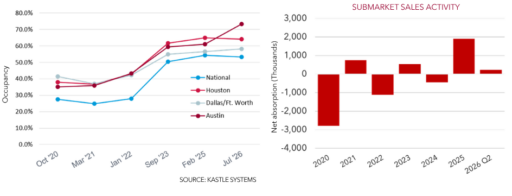
RETURN-TO-OFFICE TRENDS SUPPORT DEMAND
Houston continues to outperform both the national average and Dallas/Fort Worth in office attendance, reinforcing that workplace utilization has stabilized across the market. While Austin remains the strongest performer, Houston’s improving occupancy and return to positive net absorption suggest tenant confidence continues to build, supporting future leasing demand.
Office attendance has remained stable through July, reinforcing that the positive leasing momentum established during the second quarter has continued into early Q3 2026.
Workplace occupancy has stabilized, while leasing fundamentals continue to strengthen.
Construction Pipeline
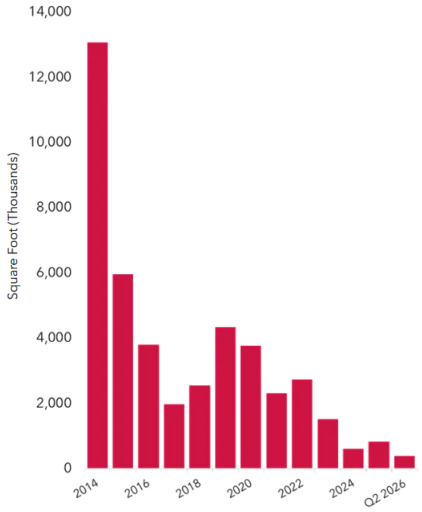
Houston’s office development pipeline continued to contract during the second quarter as developers remained cautious amid elevated vacancy, higher financing costs, and ongoing uncertainty surrounding long-term office demand.
- Space under construction declined to just 337,651 square feet, a 30.2% decrease from Q1 2026, marking one of the smallest active office development pipelines Houston has experienced in more than a decade.
- The sharp reduction reflects more than slowing construction activity—it highlights a market where speculative office development has largely paused. Today’s projects are overwhelmingly build-to-suit, owner-occupied, or substantially pre-leased, reducing the risk of introducing additional vacant inventory into an already well-supplied market. At the same time, the completion of recent developments has further reduced the amount of office space currently under construction.
- Looking ahead, the limited construction pipeline should continue supporting Houston’s long-term recovery by preventing a significant increase in available inventory. While elevated vacancy will likely limit new speculative development for the foreseeable future, restrained supply, improving leasing fundamentals, and continued employment growth should gradually strengthen market balance as existing office space is absorbed.
Quarterly Trend Analysis
| 2026 Q2 | 2026 Q1 | 2025 Q4 | 2025 Q2 | 2025 Q1 | |
|---|---|---|---|---|---|
| DIRECT VACANCY RATE | 22.9% | 23.1% | 22.8% | 22.5% | 23.4% |
| DIRECT ASKING GROSS RATE | $31.48 | $31.07 | $31.08 | $2.58 | $29.18 |
| LEASING ACTIVITY | 2,376,783 | 2,860,602 | 0 | 2,596,679 | 2,482,508 |
| SALE TRANSACTIONS | 7,674,510 | 2,557,003 | 2,740,735 | 10,500,886 | 5,335,483 |
| NET ABSORPTION | 496,066 | (277,613) | (180,316) | 377,456 | 610,275 |
| CONSTRUCTION PIPELINE | 337,651 | 483,654 | 820,234 | 869,351 | 741,700 |
| DELIVERIES | 657,583 | 511,580 | 80,000 | 49,117 | 0 |
| AVAILABLE SUBLEASE | 4,738,673 | 4,899,748 | 5,611,529 | 5,468,998 | 5,678,272 |
Houston’s office market continued to build on its gradual recovery during the second quarter, with improving fundamentals providing additional evidence that the market is moving in the right direction.
Direct asking gross rents increased 1.3% quarter over quarter to $31.48 per square foot, while the direct vacancy rate declined 20 basis points to 22.9%, reflecting continued pricing resilience and modest occupancy gains.
Although quarterly leasing activity moderated to 2.4 million square feet, tenant demand remained healthy as net absorption rebounded to 496,066 square feet, representing a 773,000-square-foot improvement from the prior quarter.
At the same time, available sublease space continued to decline, reinforcing that occupiers remain active despite an elevated supply of available office space. On the supply side, the office construction pipeline contracted another 30.2% quarter over quarter to 337,651 square feet, one of the smallest development pipelines Houston has recorded in more than a decade.
Investment sales activity was highlighted by the acquisition of Greenway Plaza, illustrating continued investor interest in premier office assets while reinforcing that capital remains highly selective. Overall, Houston’s office market continues to transition from stabilization toward a gradual, quality-driven recovery, supported by resilient rental rates, improving absorption, limited new construction, and continued flight-to-quality leasing trends.
Key Activities
| TENANT | BUILDING NAME/ADDRESS | SIZE (SF) | SUBMARKET |
|---|---|---|---|
| COMMENCEMENTS | |||
| Dow | CityCentre Six Office | 203,000 | Katy Freeway East |
| Vitol | The RO | 150,794 | Greenway Plaza |
| Boardwalk Pipelines | 990 Town and Country Boulevard | 143,253 | Katy Freeway East |
| LEASING ACTIVITY | |||
| Mitsubishi Corporation | 1100 Louisiana Street | 91,761 | Central Business District |
| Superior Energy | 8020 Katy Freeway | 56,256 | Katy Freeway East |
| Armstrong Lee & Baker | Brookhollow Central I | 36,476 | North Loop West |
| SUBLEASE | |||
| NOV | NOV Headquarters | 410,465 | Southwest/Beltway 8 |
| JP Morgan Chase | The Jones on Main | 122,365 | Central Business District |
| McDermott International | Energy Center V | 99,501 | Katy Freeway West |
| BUYER | SELLER | BUILDING NAME/ADDRESS | SIZE (SF) | SUBMARKET |
| SALE TRANSACTIONS | |||
| Interra Properties | Trigild | Greenway Plaza Portfolio | 4,311,629 | Greenway Plaza |
| Zhukovski Development | Credit Suisse | 919 Milam | 542,919 | Central Business District |
| AAA Investments | Silver Star Properties REIT | Preserve at North Loop Portfolio | 225,628 | North Loop West |
| DEVELOPER | BUILDING NAME/ADDRESS | SIZE (SF) | SUBMARKET |
| DELIVERIES | |||
| Transwestern | The RO | 150,794 | Greenway Plaza |
| UNDER CONSTRUCTION | |||
| Service Corporation International | 1945 Allen Parkway | 210,000 | Midtown |
| Hanover Company | Autry Park | 127,651 | Midtown |
| Majestic Developers | Majestic HQ | 45,883 | Fort Bend County/Sugar Land |
Sales Overview
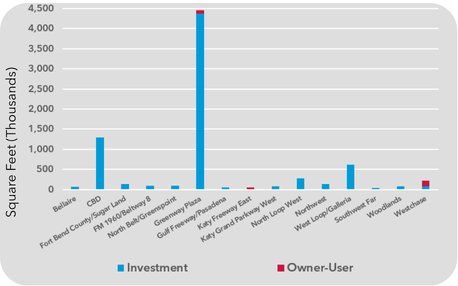
Submarket Sales Activity
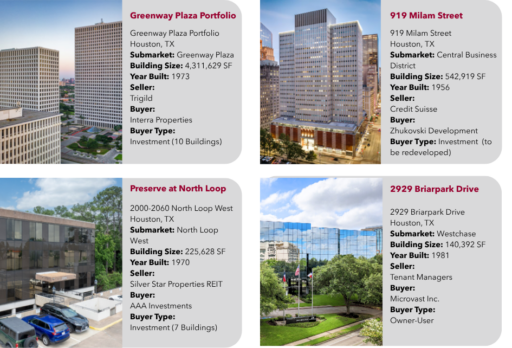
Houston’s office investment market was highlighted by Interra Capital Group’s acquisition of Greenway Plaza, one of Houston’s premier mixed-use office campuses. The 11-building, 4.5 million-square-foot transaction was among the largest completed in recent years and demonstrates that institutional investors remain willing to pursue high-quality assets despite challenging market conditions.
Beyond Greenway Plaza, investment activity remained selective, with capital targeting well-located properties offering redevelopment, leasing upside, or long-term value creation. Transactions such as 919 Milam and The Preserve at North Loop reinforce that buyers continue to focus on opportunities where repositioning can generate future returns.
Looking ahead, investment activity should remain disciplined as improving leasing fundamentals gradually restore investor confidence. However, pricing will likely remain highly asset-specific as the office market continues adjusting to post-pandemic valuations.
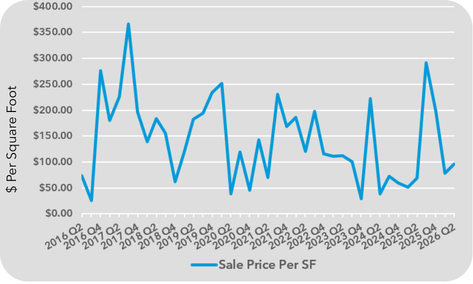
Historical Office Sale Price
Greenway Plaza illustrates the significant repricing occurring across institutional office assets. Although the purchase price was not publicly disclosed, court filings indicate Interra assumed approximately $416 million in existing debt and contributed $15 million in cash to complete the receivership acquisition. The campus previously traded for approximately $950 million in 2013, underscoring how office valuations have reset over the past decade.
Despite pricing adjustments, investors continue pursuing well-located assets where leasing improvements, redevelopment, or capital investment can create long-term value. As market fundamentals continue to improve, office investment activity should gradually expand, although buyers are expected to remain highly selective.
Notable Sales
Office Market Statistics
| SUBMARKET / CLASS | INVENTORY (SF) | DIRECT VACANCY RATE | SUBLEASE VACANCY RATE | TOTAL VACANCY RATE | PREVIOUS QUARTER DIRECT VACANCY RATE | DIRECT ASKING GROSS RENT | CURRENT QUARTER LEASING ACTIVITY (SF) | 12-MONTH LEASING ACTIVITY (SF) | CURRENT QUARTER NET ABSORPTION (SF) | 12-Month NET ABSORPTION (SF) | UNDER CONSTR. (SF) | YTD DELIVERIES (SF) |
|---|---|---|---|---|---|---|---|---|---|---|---|---|
| TOTAL HOUSTON MARKET | ||||||||||||
| Class A | 139,000,000 | 23.8% | 1.2% | 25.1% | 24.4% | $36.63 | 1,552,257 | 3,724,262 | 971,911 | 810,947 | 337,651 | 657,583 |
| Class B | 99,087,477 | 21.6% | 1.1% | 22.7% | 21.2% | $23.23 | 824,526 | 1,513,123 | (475,845) | (592,494) | 0 | 0 |
| TOTAL | 238,000,000 | 22.9% | 1.2% | 24.1% | 23.1% | $31.48 | 2,376,783 | 5,237,385 | 496,066 | 218,453 | 337,651 | 657,583 |
| CENTRAL BUSINESS DISTRICT | ||||||||||||
| Class A | 39,385,991 | 24.2% | 1.1% | 25.3% | 24.3% | $43.23 | 263,382 | 909,864 | 192,608 | (12,835) | 0 | 0 |
| Class B | 11,289,811 | 27.7% | 0.0% | 27.7% | 27.7% | $21.40 | 460 | 865 | 1,407 | 12,693 | 0 | 0 |
| TOTAL | 50,675,802 | 25.0% | 0.9% | 25.8% | 25.1% | $39.06 | 263,842 | 910,729 | 194,015 | (142) | 0 | 0 |
| SUBURBAN | ||||||||||||
| Class A | 99,478,462 | 23.7% | 1.3% | 25.0% | 24.4% | $33.65 | 1,288,875 | 2,814,398 | 779,303 | 823,782 | 337,651 | 657,583 |
| Class B | 87,797,666 | 20.8% | 1.3% | 22.1% | 20.3% | $23.47 | 824,066 | 1,512,258 | (477,252) | (605,187) | 0 | 0 |
| TOTAL | 187,276,128 | 22.3% | 1.3% | 23.6% | 22.5% | $29.14 | 2,112,941 | 4,326,656 | 302,051 | 218,595 | 337,651 | 657,583 |
| ALLEN PARKWAY/MIDTOWN | ||||||||||||
| Class A | 2,740,049 | 18.5% | 2.3% | 20.8% | 17.9% | $38.93 | 40,277 | 52,943 | (18,265) | (6,035) | 337,651 | 0 |
| Class B | 3,900,155 | 8.5% | 0.1% | 8.5% | 8.7% | $35.11 | 14,956 | 31,495 | 15,826 | (1,467) | 0 | 0 |
| TOTAL | 6,640,204 | 12.6% | 1.0% | 13.6% | 12.5% | $37.78 | 55,233 | 84,438 | (2,439) | (7,502) | 337,651 | 0 |
| BAYTOWN | ||||||||||||
| Class B | 584,259 | 2.3% | 0.0% | 2.3% | 2.3% | $17.69 | 0 | 0 | 0 | 0 | 0 | 0 |
| TOTAL | 584,259 | 2.3% | 0.0% | 2.3% | 2.3% | $17.69 | 0 | 0 | 0 | 0 | 0 | 0 |
| BELLAIRE | ||||||||||||
| Class A | 1,370,957 | 28.1% | 0.1% | 28.2% | 29.6% | $31.94 | 27,768 | 28,743 | 21,379 | (24,237) | 0 | 0 |
| Class B | 3,012,095 | 12.4% | 0.1% | 12.6% | 13.3% | $28.22 | 5,985 | 46,415 | 25,709 | 32,102 | 0 | 0 |
| TOTAL | 4,383,052 | 17.3% | 0.1% | 17.5% | 18.4% | $30.92 | 33,753 | 75,158 | 47,088 | 7,865 | 0 | 0 |
| CONROE/MONTGOMERY COUNTY | ||||||||||||
| Class A | 60,000 | 0.0% | 0.0% | 0.0% | 0.0% | N/A | 0 | 0 | 0 | 0 | 0 | 0 |
| Class B | 636,080 | 7.8% | 0.0% | 7.8% | 7.1% | $32.67 | 4,667 | 12,713 | (4,904) | 47,198 | 0 | 0 |
| TOTAL | 696,080 | 7.2% | 0.0% | 7.2% | 6.4% | $32.67 | 4,667 | 12,713 | (4,904) | 47,198 | 0 | 0 |
| GULF FREEWAY/PASADENA | ||||||||||||
| Class A | 522,746 | 7.3% | 0.0% | 7.3% | 10.3% | $35.00 | 0 | 0 | 15,624 | 15,624 | 0 | 95,000 |
| Class B | 2,447,497 | 17.8% | 0.6% | 18.4% | 17.5% | $24.22 | 74,014 | 87,915 | (9,019) | 89,775 | 0 | 0 |
| TOTAL | 2,970,243 | 16.0% | 0.5% | 16.5% | 16.2% | $25.09 | 74,014 | 87,915 | 6,605 | 105,399 | 0 | 95,000 |
| I-10 EAST | ||||||||||||
| Class B | 510,209 | 10.2% | 0.0% | 10.2% | 13.0% | $18.87 | 473 | 26,223 | 14,171 | 5,430 | 0 | 0 |
| TOTAL | 510,209 | 10.2% | 0.0% | 10.2% | 13.0% | $18.87 | 473 | 26,223 | 14,171 | 5,430 | 0 | 0 |
| KATY FREEWAY EAST | ||||||||||||
| Class A | 6,060,846 | 10.6% | 2.1% | 12.7% | 17.5% | $60.78 | 41,358 | 422,567 | 435,334 | 417,675 | 0 | 336,580 |
| Class B | 2,660,848 | 15.8% | 0.0% | 15.8% | 15.2% | $23.84 | 35,545 | 47,558 | (9,854) | (40,248) | 0 | 0 |
| TOTAL | 8,721,694 | 12.2% | 1.5% | 13.7% | 16.8% | $43.37 | 76,903 | 470,125 | 425,480 | 377,427 | 0 | 336,580 |
| KATY FREEWAY WEST | ||||||||||||
| Class A | 16,134,323 | 17.6% | 2.7% | 20.3% | 18.1% | $31.76 | 104,598 | 279,139 | 2,334 | (37,481) | 0 | 0 |
| Class B | 9,564,076 | 23.4% | 0.5% | 23.9% | 20.9% | $24.31 | 91,489 | 208,327 | (255,427) | (337,237) | 0 | 0 |
| TOTAL | 25,698,399 | 19.7% | 1.9% | 21.6% | 19.2% | $27.34 | 196,087 | 487,466 | (253,093) | (374,718) | 0 | 0 |
| NORTH LOOP WEST | ||||||||||||
| Class A | 1,474,943 | 23.5% | 0.0% | 23.5% | 23.0% | $25.95 | 87,107 | 122,030 | (6,849) | (90,395) | 0 | 0 |
| Class B | 2,166,029 | 16.1% | 0.3% | 16.4% | 17.9% | $20.79 | 31,396 | 74,547 | 49,196 | 51,132 | 0 | 0 |
| TOTAL | 3,640,972 | 19.1% | 0.2% | 19.3% | 20.0% | $23.54 | 118,503 | 196,577 | 42,347 | (39,263) | 0 | 0 |
| NORTHEAST | ||||||||||||
| Class A | 643,952 | 0.4% | 0.0% | 0.4% | 0.4% | N/A | 0 | 0 | 0 | 0 | 0 | 0 |
| Class B | 715,899 | 1.6% | 0.0% | 1.6% | 2.5% | $27.00 | 3,933 | 7,051 | 7,051 | 1,971 | 0 | 0 |
| TOTAL | 1,359,851 | 1.0% | 0.0% | 1.0% | 1.5% | $27.00 | 3,933 | 7,051 | 7,051 | 1,971 | 0 | 0 |
| NORTHWEST | ||||||||||||
| Class A | 1,003,410 | 23.6% | 0.9% | 24.5% | 20.4% | $19.49 | 9,615 | 26,838 | (32,522) | (1,736) | 0 | 0 |
| Class B | 3,799,639 | 7.2% | 1.3% | 8.6% | 7.3% | $16.96 | 34,591 | 56,298 | (7,572) | (21,423) | 0 | 0 |
| TOTAL | 4,803,049 | 10.6% | 1.2% | 11.9% | 10.1% | $17.91 | 44,206 | 83,136 | (40,094) | (23,159) | 0 | 0 |
| RICHMOND/FOUNTAINVIEW | ||||||||||||
| Class B | 730,859 | 14.8% | 0.0% | 14.8% | 13.9% | $17.19 | 0 | 4,002 | (6,088) | 20,839 | 0 | 0 |
| TOTAL | 730,859 | 14.8% | 0.0% | 14.8% | 13.9% | $17.19 | 0 | 4,002 | (6,088) | 20,839 | 0 | 0 |
| SAN FELIPE/VOSS | ||||||||||||
| Class A | 2,398,925 | 26.8% | 4.6% | 31.4% | 27.3% | $31.54 | 79,791 | 131,907 | (33,237) | (881) | 0 | 0 |
| Class B | 2,797,322 | 23.1% | 0.3% | 23.5% | 24.3% | $23.35 | 70,906 | 70,906 | 23,978 | (9,718) | 0 | 0 |
| TOTAL | 5,196,247 | 24.8% | 2.3% | 27.1% | 25.7% | $26.98 | 150,697 | 202,813 | (9,259) | (10,599) | 0 | 0 |
| SOUTH | ||||||||||||
| Class A | 587,618 | 6.4% | 0.0% | 6.4% | 3.5% | $29.01 | 3,417 | 3,417 | (16,797) | (16,797) | 0 | 0 |
| Class B | 498,805 | 7.0% | 0.0% | 7.0% | 7.1% | $30.25 | 836 | 836 | 606 | 750 | 0 | 0 |
| TOTAL | 1,086,423 | 6.6% | 0.0% | 6.6% | 5.2% | $29.60 | 4,253 | 4,253 | (16,191) | (16,047) | 0 | 0 |
| SOUTH MAIN/MEDICAL CENTER | ||||||||||||
| Class A | 250,000 | 0.0% | 0.0% | 0.0% | 0.0% | N/A | 0 | 0 | 0 | 0 | 0 | 0 |
| Class B | 1,419,791 | 9.8% | 0.4% | 10.2% | 9.2% | $18.30 | 434 | 3,439 | (13,813) | (33,689) | 0 | 0 |
| TOTAL | 1,669,791 | 8.3% | 0.4% | 8.7% | 7.9% | $23.90 | 434 | 3,439 | (13,813) | (33,689) | 0 | 0 |
| SOUTHEAST | ||||||||||||
| Class B | 228,543 | 0.0% | 0.0% | 0.0% | 0.0% | N/A | 0 | 0 | 0 | 0 | 0 | 0 |
| TOTAL | 228,543 | 0.0% | 0.0% | 0.0% | 0.0% | N/A | 0 | 0 | 0 | 0 | 0 | 0 |
| SOUTHWEST/BELTWAY 8 | ||||||||||||
| Class A | 1,070,041 | 34.5% | 0.1% | 34.6% | 34.5% | $17.76 | 4,002 | 16,167 | (757) | 272 | 0 | 0 |
| Class B | 7,126,615 | 19.6% | 6.1% | 25.7% | 19.2% | $20.94 | 31,130 | 49,670 | (26,965) | (104,669) | 0 | 0 |
| TOTAL | 8,196,656 | 21.5% | 5.3% | 26.8% | 21.2% | $19.94 | 35,132 | 65,837 | (27,722) | (104,397) | 0 | 0 |
| SOUTHWEST FAR | ||||||||||||
| Class A | 80,536 | 32.5% | 0.0% | 32.5% | 38.1% | $37.53 | 0 | 4,536 | 4,536 | 7,800 | 0 | 0 |
| Class B | 578,457 | 0.5% | 9.9% | 10.4% | 0.3% | N/A | 1,900 | 1,900 | (58,480) | (58,480) | 0 | 0 |
| TOTAL | 658,993 | 4.4% | 8.7% | 13.1% | 4.9% | $37.53 | 1,900 | 6,436 | (53,944) | (50,680) | 0 | 0 |
| WEST BELT/HIGHWAY 290 | ||||||||||||
| Class A | 3,448,953 | 24.4% | 3.8% | 28.2% | 25.2% | $31.08 | 51,105 | 188,728 | 26,709 | 34,127 | 0 | 0 |
| Class B | 2,047,122 | 30.2% | 0.0% | 30.2% | 29.8% | $24.45 | 3,296 | 5,788 | 2,447 | (12,748) | 0 | 0 |
| TOTAL | 5,496,075 | 26.6% | 2.4% | 28.9% | 26.9% | $28.69 | 54,401 | 194,516 | 29,156 | 21,379 | 0 | 0 |
| WEST LOOP/GALLERIA | ||||||||||||
| Class A | 17,528,923 | 31.6% | 0.8% | 32.4% | 32.1% | $39.69 | 214,534 | 400,476 | 95,972 | 188,977 | 0 | 0 |
| Class B | 6,529,362 | 34.2% | 0.3% | 34.5% | 33.5% | $28.40 | 80,468 | 134,421 | (41,917) | (39,837) | 0 | 0 |
| TOTAL | 24,058,285 | 32.3% | 0.7% | 33.0% | 32.5% | $36.33 | 295,002 | 534,897 | 54,055 | 149,140 | 0 | 0 |
| WESTCHASE | ||||||||||||
| Class A | 8,870,678 | 28.0% | 0.0% | 28.0% | 28.1% | $30.42 | 102,328 | 372,085 | 52,711 | 84,767 | 0 | 0 |
| Class B | 8,415,253 | 23.8% | 4.0% | 27.8% | 23.5% | $20.89 | 37,417 | 84,776 | (23,649) | (24,293) | 0 | 0 |
| TOTAL | 17,285,931 | 25.9% | 2.0% | 27.9% | 25.9% | $26.57 | 139,745 | 456,861 | 29,062 | 60,474 | 0 | 0 |
| WOODLANDS | ||||||||||||
| Class A | 13,450,944 | 7.5% | 1.2% | 8.7% | 8.2% | $45.55 | 178,612 | 289,041 | 64,185 | 145,813 | 0 | 0 |
| Class B | 3,923,822 | 15.9% | 2.6% | 18.5% | 14.6% | $29.57 | 51,603 | 90,173 | (55,877) | (92,067) | 0 | 0 |
| TOTAL | 17,374,766 | 9.4% | 1.5% | 10.9% | 9.7% | $40.31 | 230,215 | 379,214 | 8,308 | 53,746 | 0 | 0 |
Outlook
Houston’s office market continued its gradual transition from stabilization toward recovery during the second quarter, supported by improving absorption, resilient rental rates, and one of the smallest office construction pipelines in more than a decade.
- While vacancy remains elevated by historical standards, market fundamentals are steadily improving. The continued flight to quality is expected to support Class A leasing activity and rental performance, while older commodity office buildings will likely remain under pressure to compete through capital improvements, repositioning, and competitive leasing strategies.
- Limited speculative development should remain one of the market’s greatest strengths through the balance of 2026. With only 337,651 square feet under construction, Houston is well positioned to gradually absorb existing vacancy without facing significant new supply pressure. At the same time, improving office-using employment, positive net absorption, and declining sublease availability suggest occupier confidence continues to strengthen.
- Capital markets are also expected to remain active, though highly selective. Institutional investors will likely continue pursuing premier office campuses and value-add opportunities where long-term leasing potential supports future value creation. Transactions such as Greenway Plaza demonstrate that well-located assets continue to attract capital even as pricing adjusts to current market conditions.
- Overall, Houston’s office market is expected to remain defined by stable rental rates, selective leasing activity, disciplined development, and a gradual improvement in occupancy. Although the recovery is unlikely to be linear, current trends suggest the market continues moving in the right direction, with the strongest performance expected among well-located, institutional-quality office assets.
Key Opportunities & Risks
Opportunities
- Flight-to-quality continues supporting demand for premier office assets.
- Limited new construction is helping restore long-term market balance.
- Improving workplace attendance and positive absorption support continued recovery.
Risks
- Elevated vacancy continues to pressure older commodity office properties.
- Tenant demand remains selective, resulting in an uneven pace of recovery.
- Capital investment and leasing activity remain highly asset-specific.
Economic Update
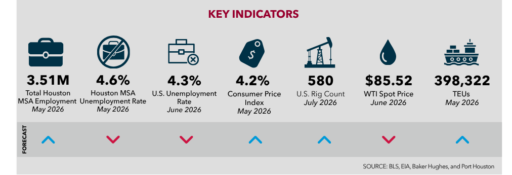
Houston’s economy remains resilient, supported by steady employment levels, moderate inflation, and continued strength in energy and trade-related activity.
Houston’s economic fundamentals remained healthy through mid-2026. Total employment reached 3.5 million in May 2026, while the local unemployment rate measured 4.6% in May 2026. The U.S. unemployment rate is 4.2% and is consistent with historical averages. Labor market conditions continue to support business activity across the region.
Inflation remained above historical norms, with the Consumer Price Index increasing 4.2% year-over-year in May 2026, though price growth has generally stabilized compared to recent peaks. Houston’s energy sector remained a key economic driver, as WTI crude oil averaged $85.52 per barrel in June 2026 and the U.S. rig count totaled 580 in July 2026, supporting continued drilling and investment activity.
Trade and logistics also remained strong, with Port Houston handling 398,322 TEUs in May 2026, up from 381,640 TEUs in May 2025. Together, steady employment growth, resilient energy activity, and expanding trade volumes continue to provide a solid foundation for regional economic growth and industrial demand.
Office Employment Growth
Growth By Industry
April 2026 – Year-Over-Year Change
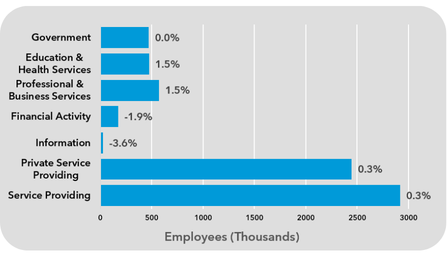
Professional services and healthcare continue to support Houston’s office market, though weakness in information and financial services is tempering overall employment growth.
Houston’s office-related employment remained stable in April 2026, with both Service Providing and Private Service Providing employment increasing 0.3% year over year. Professional and Business Services employment grew 1.5% to 572,000 jobs, while Education and Health Services also increased 1.5% to 474,600 jobs, supporting demand from two of the region’s largest office-using sectors.
Several office-oriented industries continued to experience modest declines. Information employment fell 3.6% to 27,400 jobs, while Financial Activities declined 1.9% to 175,600 jobs. Government employment remained unchanged, indicating limited growth from the public sector.
Overall, steady gains in professional services and healthcare continue to support Houston’s office market, although softness in information and financial services may moderate office demand in the near term.
Employment Growth
April 2026 – 10 Year Change
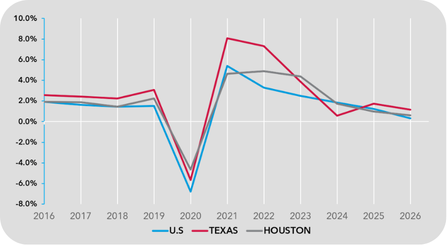
Houston’s office-using employment growth has gradually normalized following the post-pandemic recovery, reflecting a return to more sustainable hiring levels.
Over the past decade, Houston’s office-using employment trends have generally tracked those of Texas and the U.S., supported by growth in professional services, financial activities, and corporate operations. Following steady expansion from 2016 through 2019, the pandemic led to a 4.7% decline in employment in 2020, though Houston outperformed both Texas and the U.S. during the downturn.
Employment rebounded in 2021 and remained positive through 2026, with growth reaching 4.6% in 2021, 4.9% in 2022, and 4.4% in 2023 before moderating to 1.8% in 2024, 1.0% in 2025, and 0.6% in 2026. While hiring has slowed, Houston has continued to post positive office-using employment growth, supporting a stable outlook for office demand as employers transition to a more measured pace of expansion.
Submarket Map
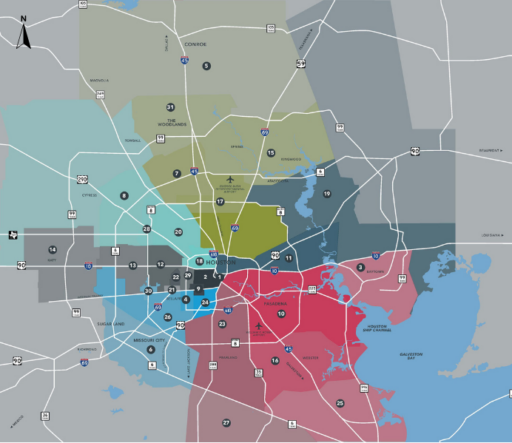
1 – Central Business District
2 – Allen Parkway/Midtown
3 – Baytown
4 – Bellaire
5 – Conroe/Montgomery County
6 – Fort Bend County/Sugar Land
7 – FM 1960/Beltway 8
8 – FM 1960/Hwy 249
9 – Greenway Plaza
10 – Gulf Freeway/Pasadena
11 – I-10 East
12 – Katy Freeway East
13 – Katy Freeway West
14 – Katy/Grand Parkway West
15 – Kingwood/Humble
16 – NASA/Clear Lake
17 – North Belt/Greenspoint
18 – North Loop West
19 – Northeast
20 – Northwest
21 – Richmond/Fountainview
22 – San Felipe/Voss
23 – South
24 – South Main/Medical Center
25 – Southeast
26 – Southwest/Beltway 8
27 – Southwest Far
28 – West Belt/Highway 290
29 – West Loop/Galleria
30 – Westchase
31 – Woodlands
Office Advisors
Managing Principal
Landlord representation
Principal
Principal
Principal
Executive Vice President
Director
Director
Associate
Tenant Representation
Principal
Associate
Associate
Research Team
- MARY DOETTERL | RESEARCH DIRECTOR | | [email protected]
- NATHAN KRUEGER | RESEARCH ANALYST
- JASMINE HUANG | JUNIOR RESEARCH ANALYST
Houston Citywide Office Market Report
Submit your email to download the Quarterly Houston Citywide Office Market Report